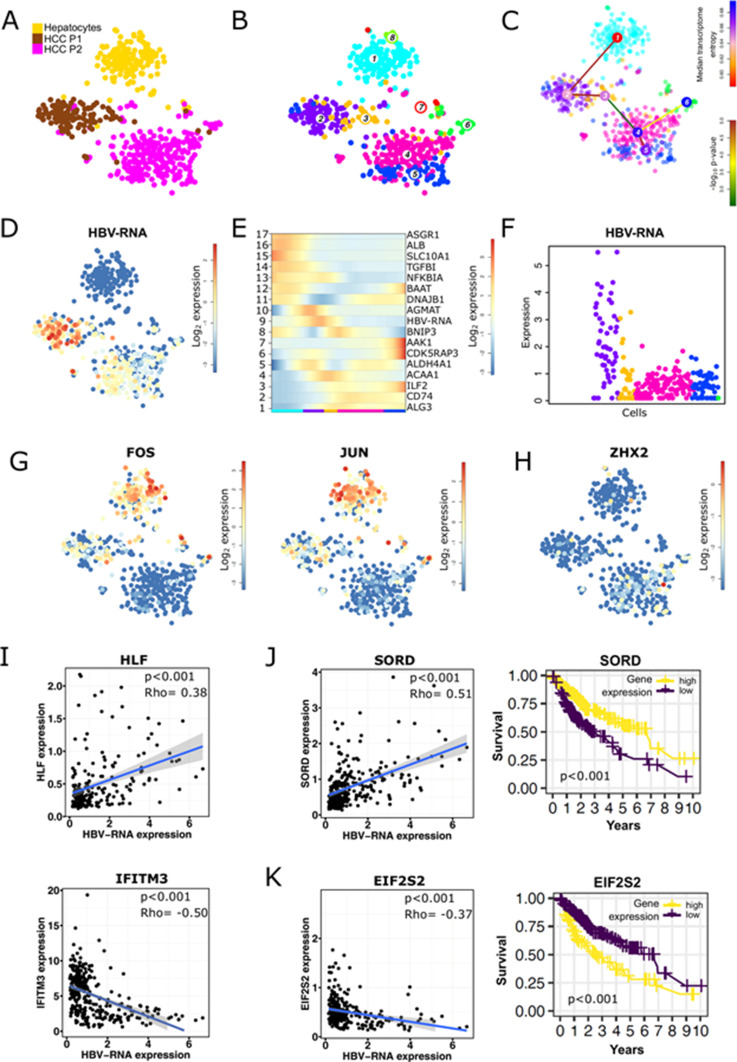
Figure 2. Intertumor heterogeneity of HBV-RNA expression and virus-host factor interaction analysis.
(A, B, C, D, E, F) HBV-RNA levels are linked to the differentiation state of the cells. (A) t-SNE map of HCC P1, HCC P2, and healthy hepatocytes from Aizarani et al (2019). (B) Unsupervised and HBV-independent k-medoids clustering of hepatocytes and cancer cells resulted in eight clusters. (C) Differentiation lineage reconstruction connecting hepatocytes (cluster 1) progressively with less differentiated cancer cells (cluster 2–6). (D) Expression t-SNE of HBV-RNA. (E) Self-organizing map of pseudo-temporal expression profiles along the differentiation branch; one representative gene from each module is shown. (F) Single-cell HBV-RNA expression along the differentiation lineage. Colors indicating cell clusters refer to (B), and only cells originating from HBV-infected tumors are shown. (G, H) Expression t-SNE of HBV–host factors. (G) Expression t-SNE FOS and JUN, known HBV replication enhancers, show higher expression in hepatocytes and HCC P1. (H) Expression t-SNE ZHX2, a known HBV replication inhibitor, which is higher expressed in HCC P2. (I) Single-cell correlation analysis between HBV-RNA and HLF, a HBV-host factor enhancing viral replication, and IFITM3, an antiviral protein, shown for P1 and P2 in cancer cells; P-values for spearman correlation. (J) HBV-RNA correlates positively in P1 and P2 cancer cells with SORD, encoding for sorbitol dehydrogenase, a novel good prognosis marker in liver cancer patients. (K) HBV-RNA correlates negatively with EIF2S2, a translation initiation factor and a novel poor prognosis marker in liver cancer patients. Kaplan–Meier curves of survival data of liver cancer patients from TCGA data.

