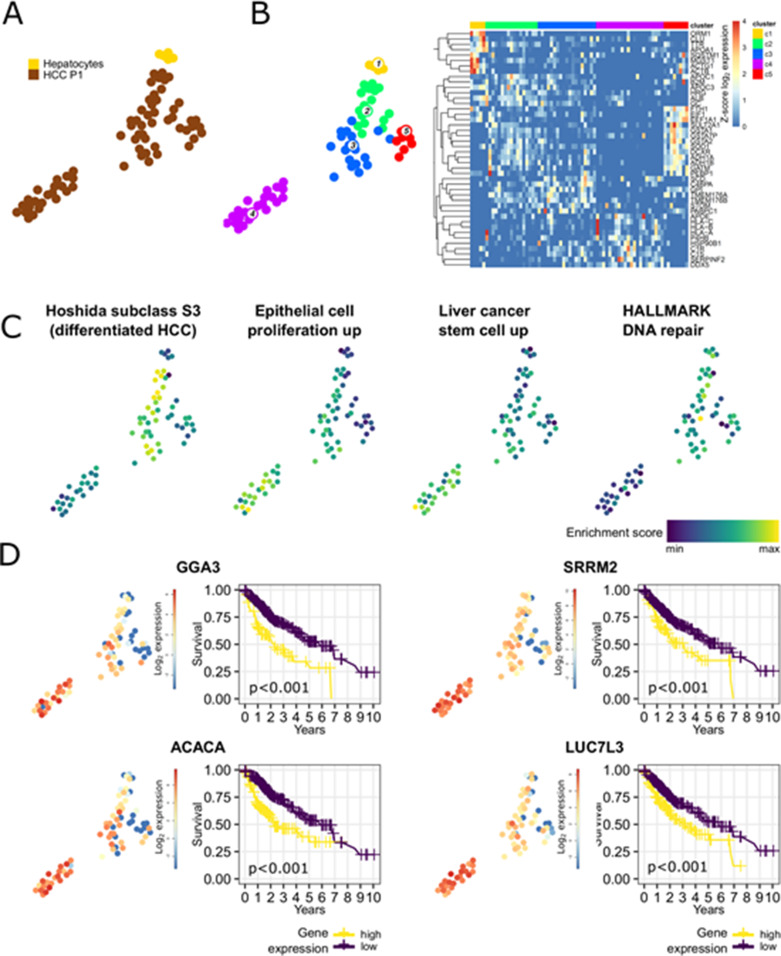
Figure 3. Intratumor heterogeneity of HCC P1 analyzed by Smart-Seq2, a full-length scRNA-seq.
(A) Fruchterman Reingold map of HCC P1 and healthy hepatocytes sequenced by Smart-Seq2. (B) Unsupervised k-medoids clustering of all single cells resulted in five clusters (left) and most differentially expressed genes throughout them (heat map, right). (C) Single-cell pathway enrichment analysis showing heterogeneity in enrichment for pathways associated with tumor differentiation (Hoshida subclass S3 and DNA repair) or undifferentiation/proliferation (Epithelial cell proliferation and Liver cancer stem cell) with a more aggressive and undifferentiated phenotype in cluster 4. (D) Poor prognosis genes in liver cancer are higher expressed in cluster 4. Kaplan–Meier curves of survival data of liver cancer patients from TCGA data.

