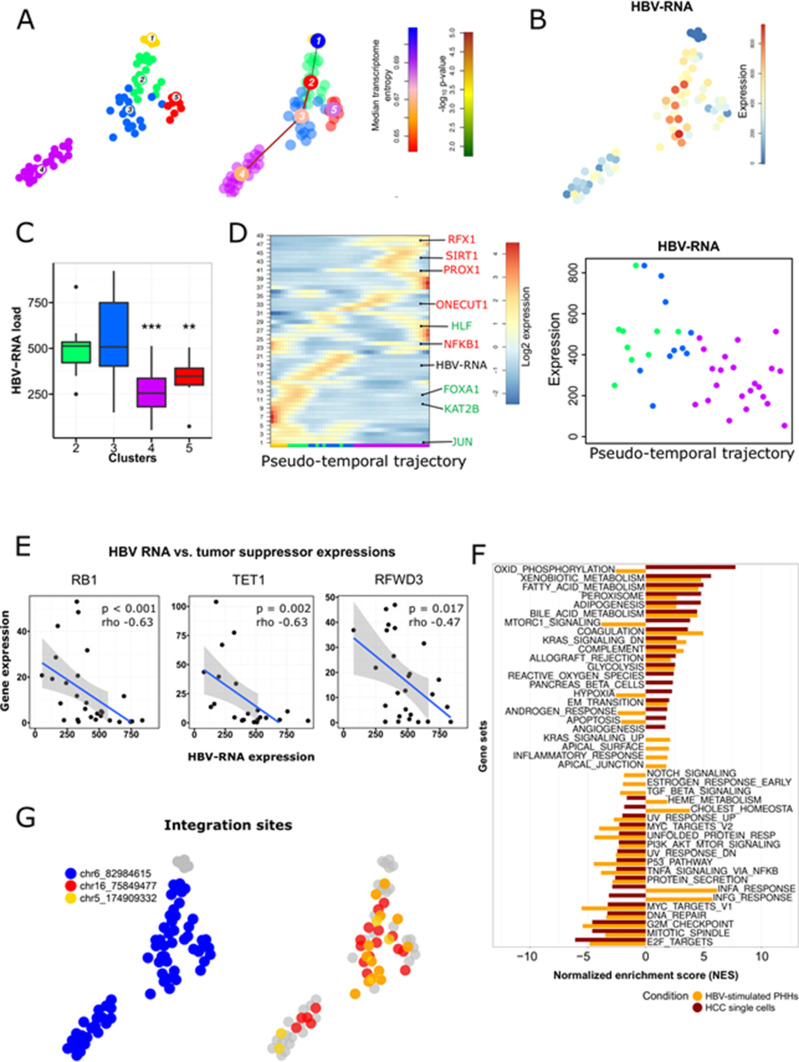
Figure 4. Intratumor heterogeneity of HBV-RNA in HCC P1.
(A) t-SNE map of HCC P1 cells and healthy hepatocytes sequenced using Smart-Seq2 (left), and the results of a differentiation lineage reconstruction by pseudo-temporal ordering the single cell’s expression profiles. The calculated trajectory, starting in hepatocytes (cluster 1), is progressively following the differentiation status of cells (see Fig 3C), and ends in less differentiated cancer cells (cluster 4). (B) Expression t-SNE map showing higher HBV-RNA in the more differentiated clusters (2 and 3). (C) Viral compartmentalization with significant differences (Mann–Whitney test. *P < 0.05; **P < 0.01, ***P < 0.001) of HBV reads in HCC cell clusters. Colors indicating cell clusters refer to Fig 3B. (D) Self-organizing map of pseudo-temporal expression profiles along the differentiation branch; HBV-RNA and representative genes enhancing (green) or inhibiting (red) HBV replication are shown in the corresponding modules. (A) Colors indicating cell clusters along the trajectory refer to (A). (E) HBV-RNA level inversely correlated with tumor suppressor genes RB1, TET1, and RFWD3 at single-cell level; P-values for Spearman correlations. (F) Pathway analysis comparing enriched pathways in HBV-stimulated PHHs (GEO ID GSE69590), and HCC P1 single cells using, as gene set, genes significantly correlating with HBV RNA level. (G) Top three HBV integrations sites per single cell showing clonal origin of HCC P1.

