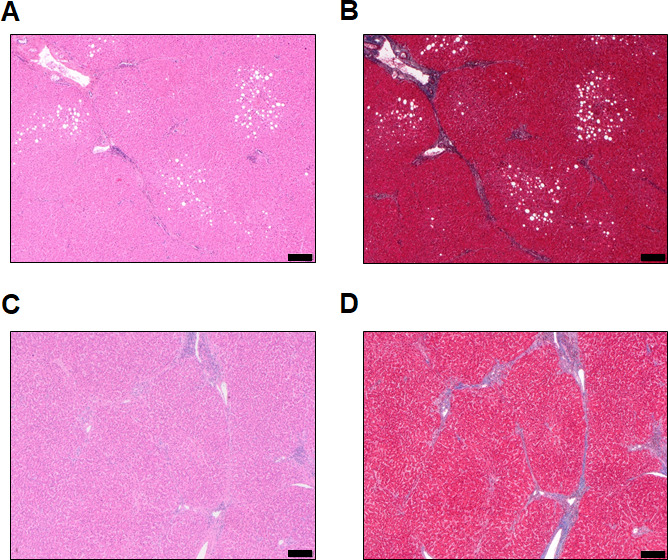
Figure S2. Histopathology features of the adjacent non-tumoral tissue.

(A, B, C, D) Patient P1. Haematoxylin and eosin (A) and Masson’s Trichrome (MT, B) staining showing mild steatosis of hepatocytes and fibrotic enlargement of portal tract with rare septa (C, D) Patient P2. (C, D) HE (C) and MT (D) staining showing fibrotic enlargement of portal tract with rare septa (Scale bar = 200 µm).
