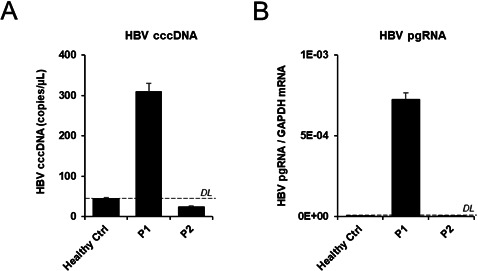
Figure S4. HBV cccDNA and pgRNA quantification in tumor samples from P1 and P2.

(A). Total DNA was extracted from tumor tissue from P1 and P2 patients as well as healthy primary hepatocytes from a HBV-negative control patient (Healthy Ctrl). cccDNA levels were assessed by qPCR. Results are expressed as mean ± SD cccDNA copies/μl from three independent biological samples (n = 3). (B) Total RNA was extracted from tumor tissue from P1 and P2 patients as well as healthy primary hepatocytes from a HBV-negative control patient (Healthy Ctrl). cccDNA levels were assessed by qPCR. Results are expressed as mean ± SD pgRNA mRAN/GAPDH mRNA from three independent biological samples (n = 3).
