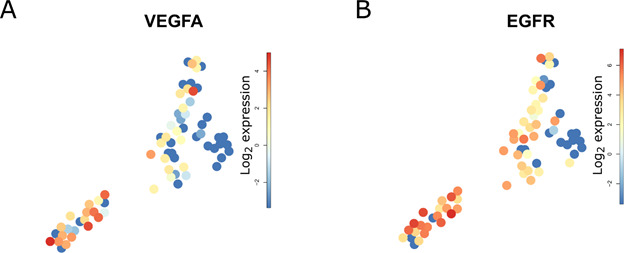
Figure S5. VEGFA and EGFR expression in HCC P1.

(A, B) Fruchterman Reingold expression map of (A) VEGFA and (B) EGFR showing higher level of these genes in cluster 4.

(A, B) Fruchterman Reingold expression map of (A) VEGFA and (B) EGFR showing higher level of these genes in cluster 4.