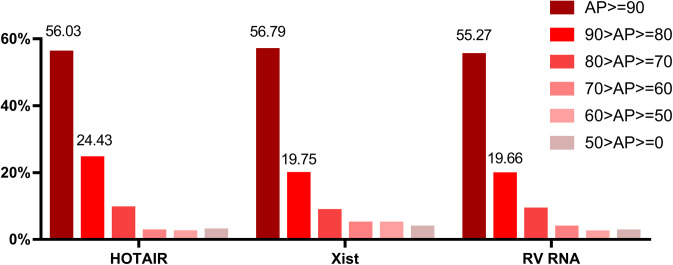
Figure S8. Distribution of protein abundance percentile (AP) for the ChIRP-MS identified RNA-interacting proteins.
The AP distribution of HOTAIR-interacting proteins, Xist-interacting proteins and RV-interacting proteins were shown. AP refers to relative protein abundance based on copy numbers. Copy numbers of all proteins were sorted into percentiles, an AP value of “90” means that the protein is more abundant than 90% of the other proteins in the HeLa spatial proteome database (Itzhak et al. 2016). AP of each ChIRP-MS data was divided into six classes from 100 (largest) to 0 (smallest).

