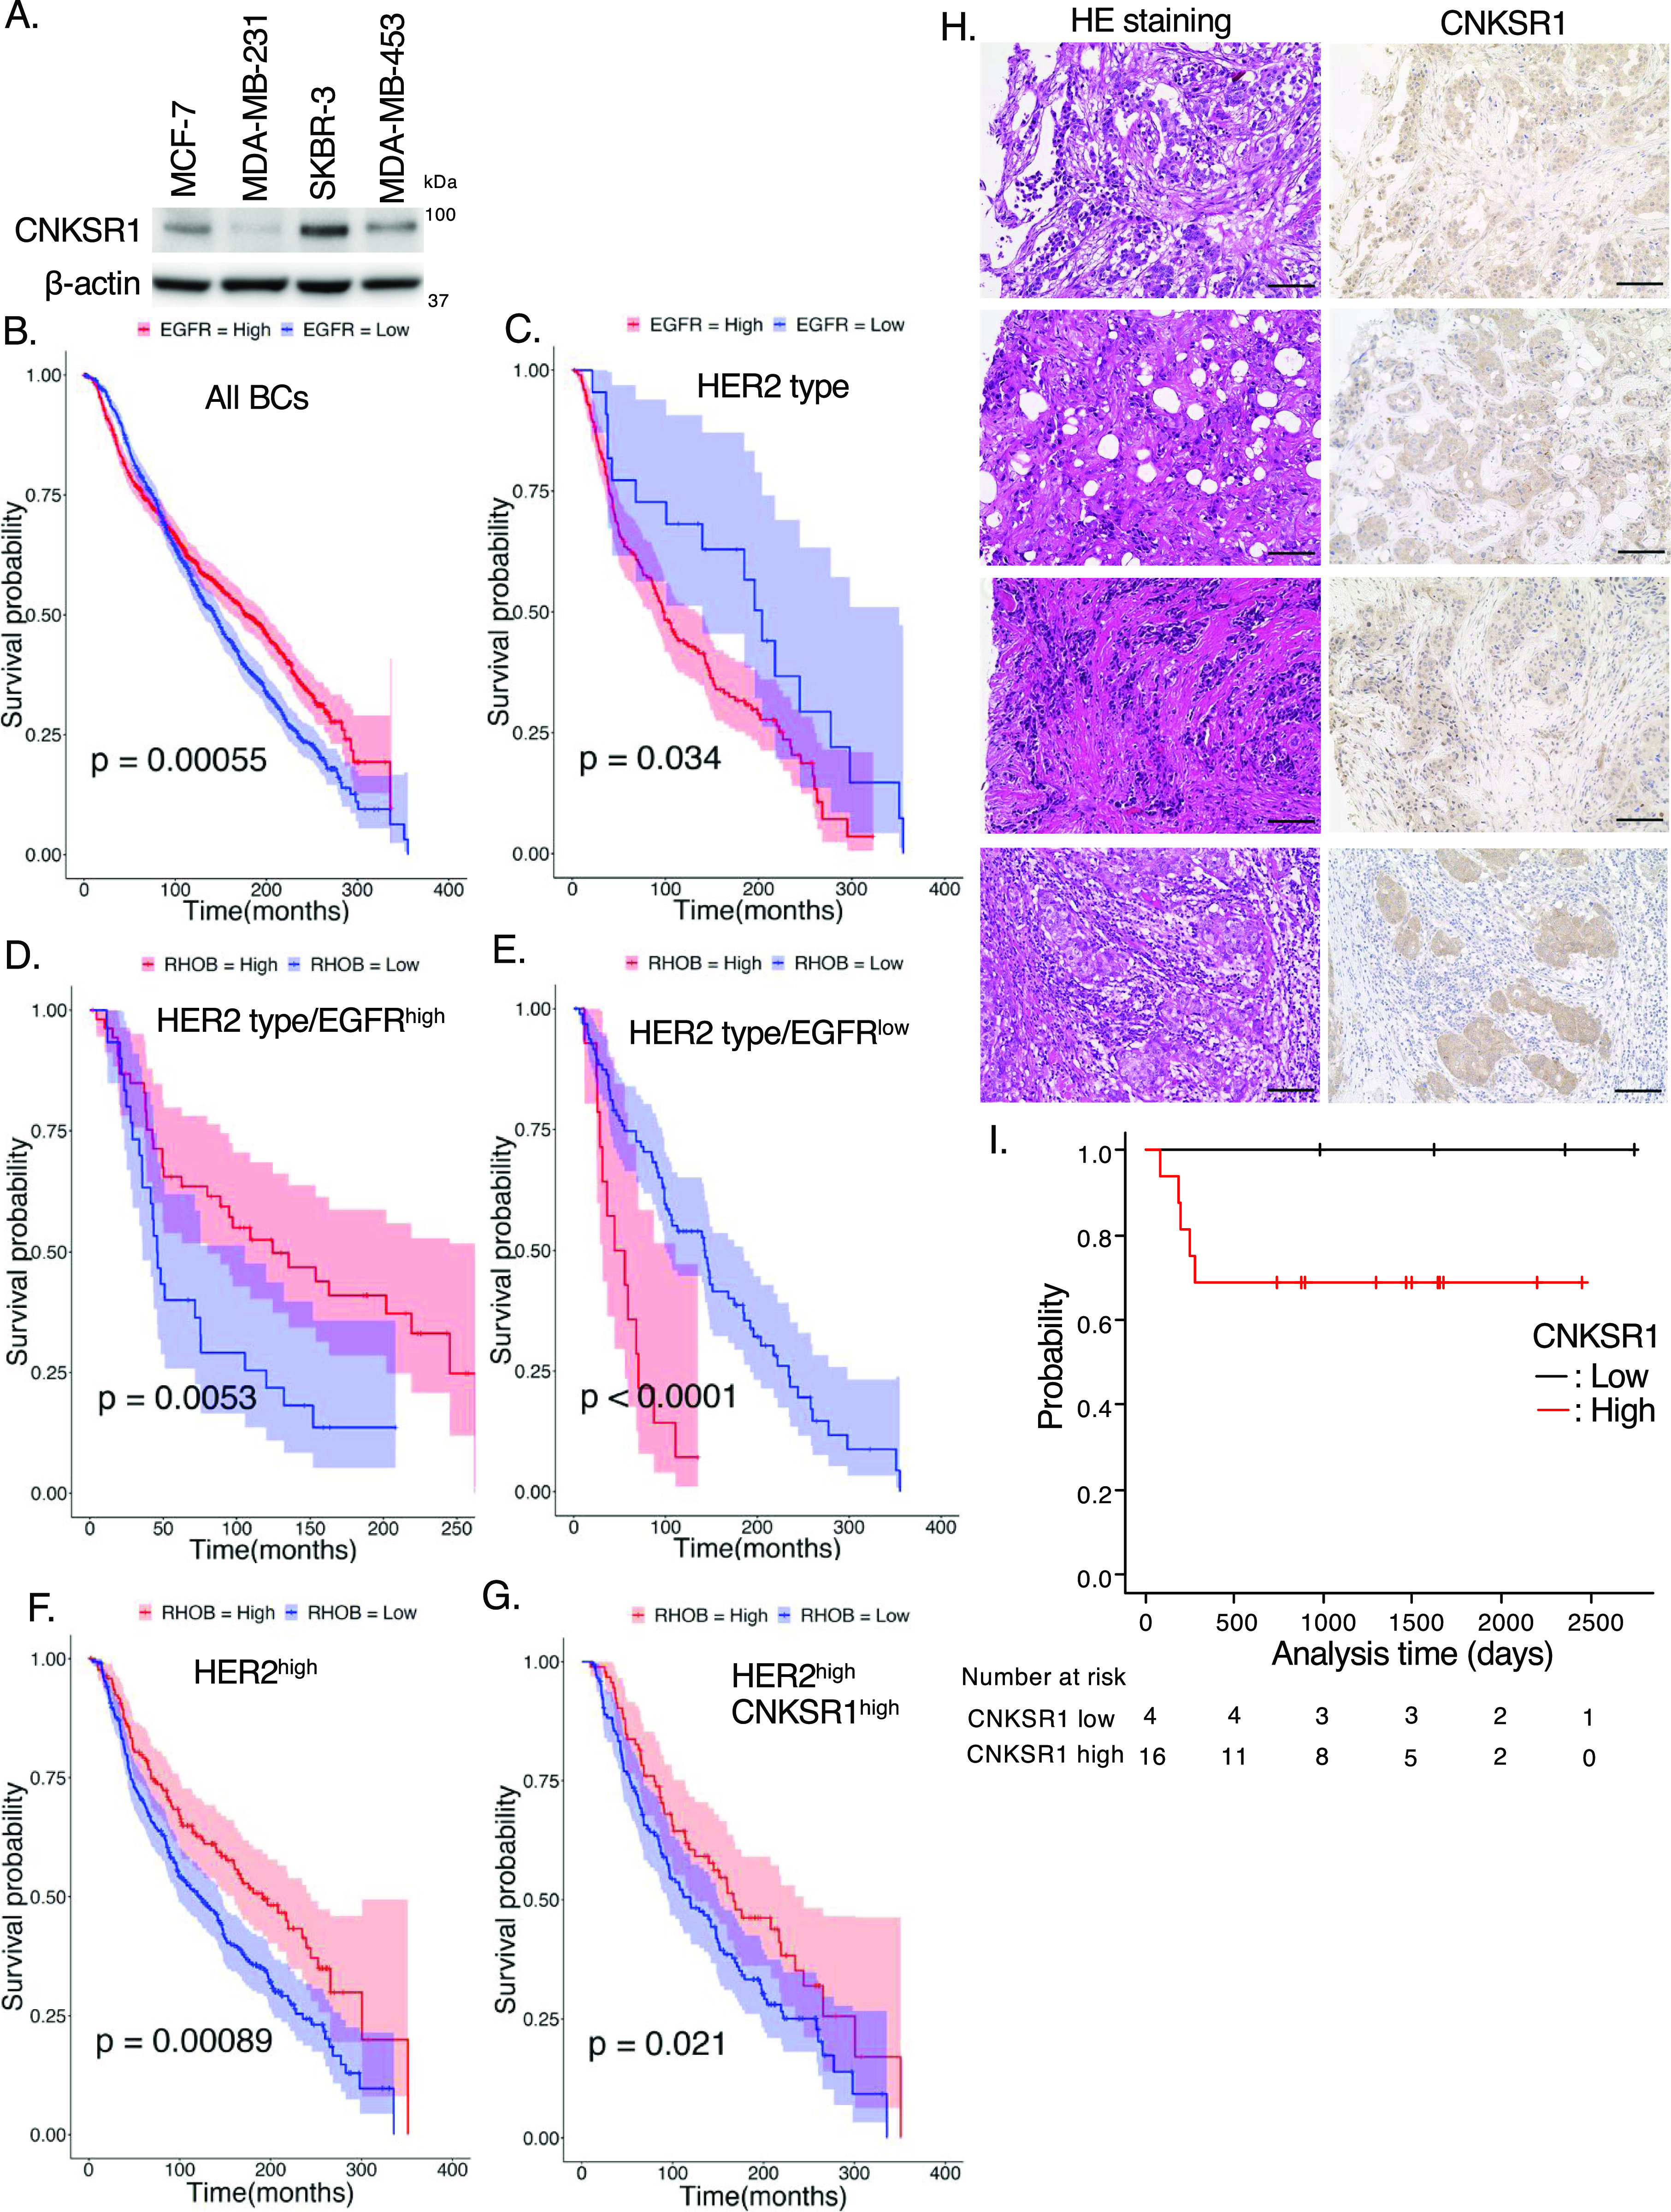
Figure 5.
Clinical significances of RhoB and connector enhancer of kinase suppressor of Ras1 (CNKSR1) in human HER2-positive breast cancers. (A) Western blots of human breast cancer cell lines. MCF-7 cells (luminal type), MDA-MB-231 cells (basal type), SKBR-3 cells, and MDA-MB-453 cells (HER2-positive). (B, C, D, E, F, G) Kaplan–Meier plot with epidermal growth factor receptor (EGFR) (B, C) or RhoB (D, E, F, G) expression profiles in Molecular Taxonomy of Breast Cancer International Consortium cohort using overall survival status. Shading along the curve showed 95% confidential interval. (B) Analysis with all samples showed that high expression of EGFR was not correlated to poor prognosis (B; high: n = 974, low: n = 930). (C) In HER2-positive subtype, high expression of EGFR was correlated to poor prognosis (C; high: n = 198, low: n = 22). (D) In HER2-positive/EGFRhigh type, low mRNA expression of RhoB was correlated to poor prognosis (D; high: n = 54, low: n = 30). (E) In HER2-positive/EGFRlow type, high mRNA expression of RhoB was correlated to poor prognosis (E; high: n = 14, low: n = 96). (F, G) In both HER2high and HER2high/CNKSR1high breast cancers, low mRNA expression of RhoB was correlated to poor prognosis (F; High: n = 172, Low: n = 304, G; high: n = 92, low: n = 146, respectively). (H) Expression of CNKSR1 protein in human HER2-positive breast cancer tissues (n = 20). Representative images of the hematoxylin and eosin staining and immunohistochemical staining for CNKSR1 in primary lesions of HER2-positive breast cancers with metastatic recurrence were shown. The neighboring sections of the human HER2-positive breast cancer tissues were subjected to hematoxylin and eosin staining and immunohistochemistry. Bars; 100 μm. See also Table 1. (I) The Kaplan–Meier plot with protein expression profiles of CNKSR1 in human HER2-positive breast cancer using end point disease-free survival status. The high expression of CNKSR1 was correlated to poor prognosis for disease-free survival (high: n = 16, low: n = 4).
Source data are available for this figure.

