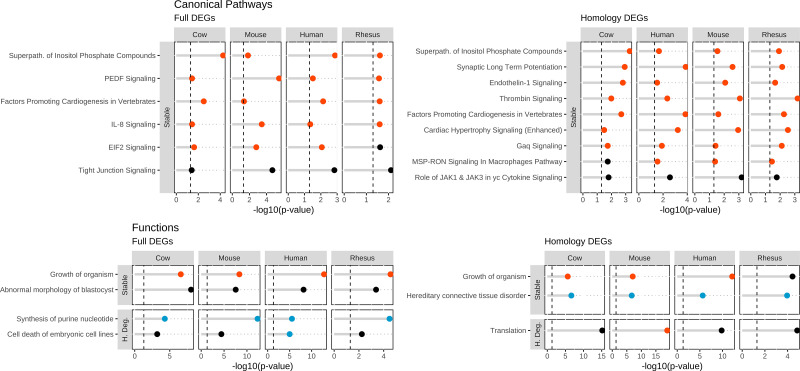
Figure 4.
Additional Ingenuity Pathway Analysis (IPA) features during maturation shared by all species. IPA entries pertinent to oocyte maturation shared by all species while not present in All-4 and 4&3 analyses. The four panels show IPA CP and BF results obtained for DEGs identified by the full and homology methods. Each panel has two vertical facet plots for each mRNA stability classification: stable and highly degraded. For each plot, the x-axis denotes the −log10(P value) and the y-axis are the IPA entries. The color of each points represents the z-score: activated = red, inhibited = blue, no-significant = black. Vertical dashed lines at 1.3 equates to a P value of 0.05. Associated data and additional IPA entries are listed in Supplemental Tables S8 and S9.

