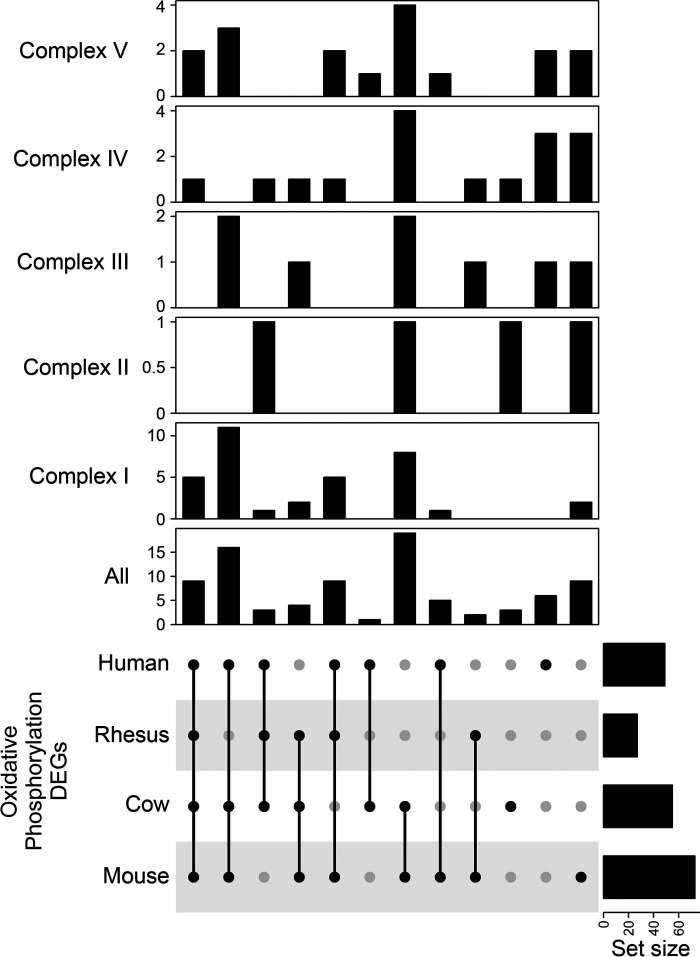
Figure 6.
Overlap of species regulation of differentially expressed genes (DEGs) in the oxidative phosphorylation pathway. UpSet plot depicting the overlap of highly degraded DEGs from each species that were found in the oxidative phosphorylation pathway. Figure depicts the overlaps for the entire pathway and DEG membership by mitochondrial complexes.

