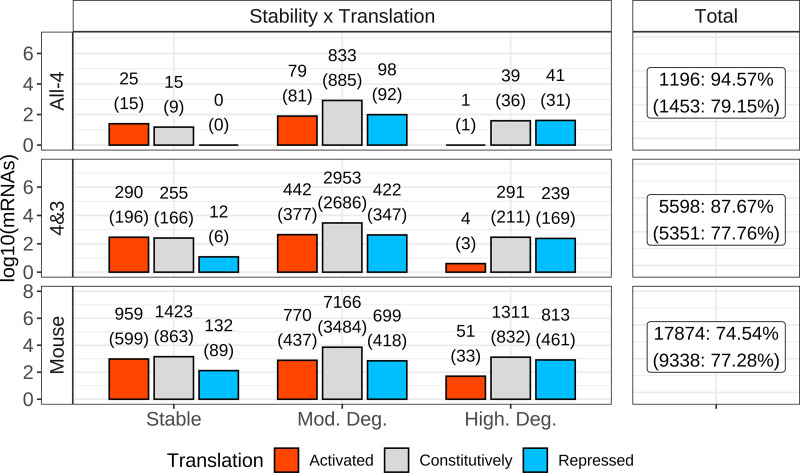
Figure 7.
Connecting stability and translational classification. For the three stability classifications (stable, moderately degraded, and highly degraded), mRNAs were intersected with translational classifications (activated, constitutively, and repressed). The x-axis represents the three stability classes, and the y-axis the number of mRNAs identified. The left facet of the figure is split into three rows, representing gene list origin: All-4, 4&3, and whole species (WS) mouse. Labels above bars denote number of genes from the full method on top, with the number generated from the homology method within parenthesis. The summation of the total number of identified genes, per gene list, are shown in the right facet. Coloring denotes translational classifications: red = activated, gray = constitutively, and blue = repressed.

