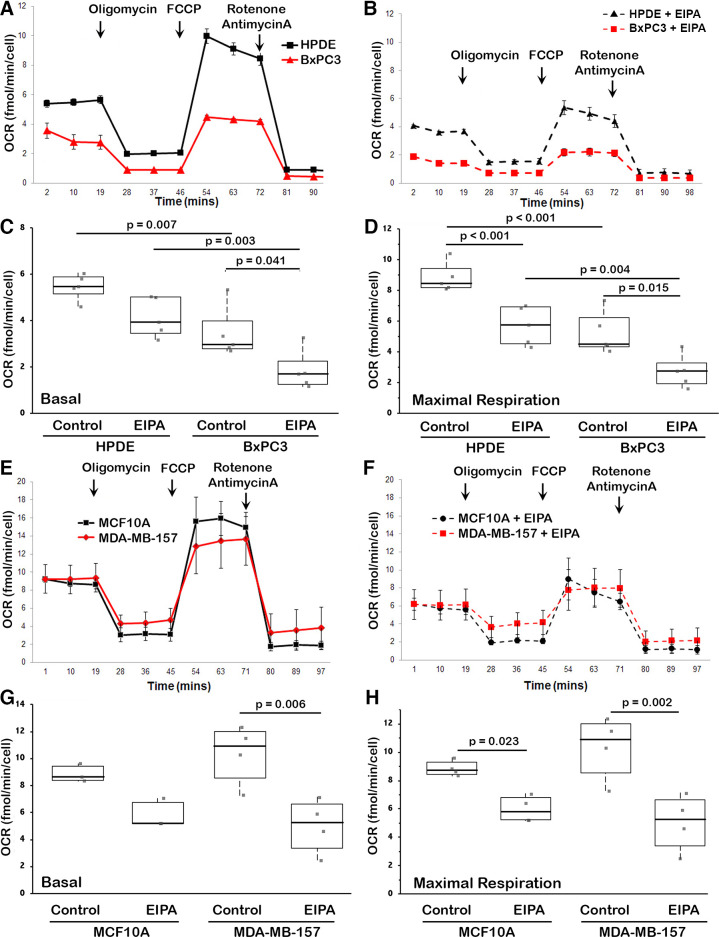
Figure 1.
Oxygen consumption rates (OCR) for the indicated cell types and conditions. A and B: mitochondrial stress test with human pancreatic ductal epithelial (HPDE) and BxPC3 cells for control (A) and with ethyl isopropyl amiloride (EIPA) (10 µM) (B). As labeled in A, shown is basal OCR before sequentially adding mitochondrial transporter inhibitors at 1 µM, including oligomycin for ATP-linked respiration, FCCP for maximal respiration, and antimycin + rotenone for spare respiratory capacity. Data are means ± SE of five separate cell preparations. C and D: basal (C) and maximal (D) OCR for HPDE and BxPC3 cells in the absence (control) and presence of EIPA. Data are from five separate cell preparations. Box plots show median, first, and third quartile, with whiskers extending to observations within 1.5 times the interquartile range, and all individual data points. Statistical analysis by Tukey–Kramer honest significant difference (HSD) test. E and F: mitochondrial stress test as in (A) with MCF10A and MDA-MB-157 cells for control (E) and with EIPA (F). Data are means ± SE of five separate cell preparations. G and H: basal (G) and maximal (H) OCR for HPDE and BxPC3 cells in the absence (control) and presence of EIPA. Data are from n = 5 separate experiments for HPDE and BxPC3 cells and n = 4 separate experiments for MCF10A and MDA-MB-157 cells with Box plots and statistical analysis as described for C and D.

