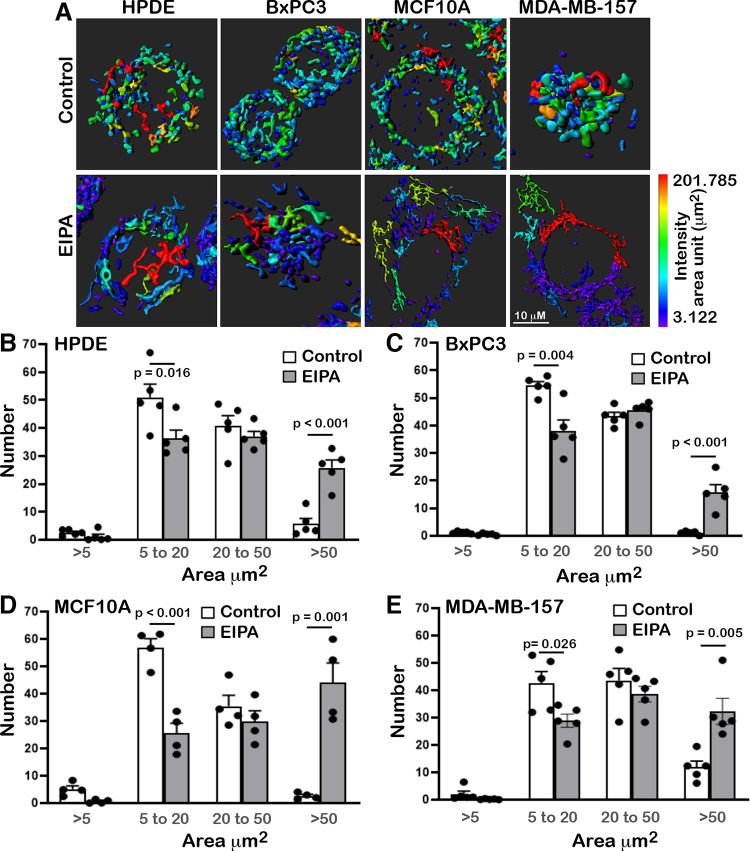
Figure 4.
Ethyl isopropyl amiloride (EIPA) changes mitochondrial morphology. A: Imaris reconstructions of confocal images of the indicated cell types stained with Mitotracker DeepRed in the absence (control) or presence of EIPA (10 µM). Heat map of mitochondrial lengths and scale bar are included at bottom right. B–E: for each indicated cell line, quantified mitochondrial lengths measured from confocal imagines using Imaris software, as indicated in Materials and Methods, and binned using Excel software into four categories, 0–5 μm, 5–20 μm, 20–50 μm, and >50 μm, with data expressed as the number of mitochondrial structures within each category. Data are means ± SE of five fields of view from two cell preparations with statistical analysis by Student’s paired t test.

