Figure 2.
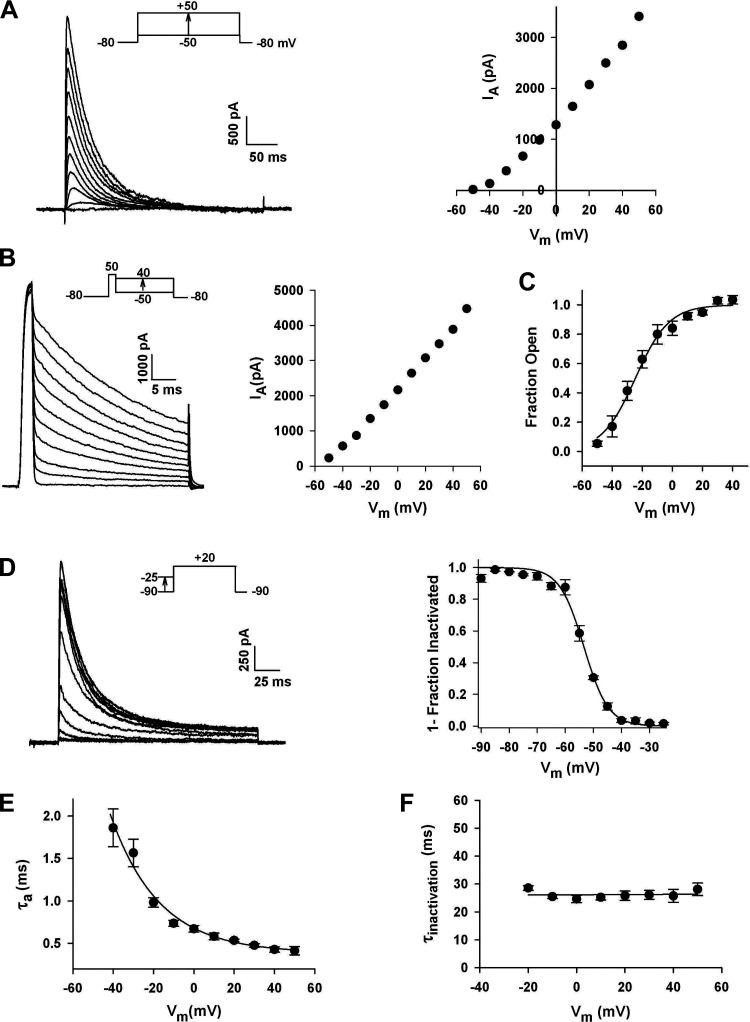
Voltage-dependent gating and kinetics of A-type K+ currents in human adrenal zona glomerulosa (AZG) cells. A: I-V relationship: whole-cell K+ currents were activated by voltage steps to various test potentials applied at 30 s intervals from a holding potential of −80 mV. Peak current amplitudes are plotted against test potential from corresponding current traces at left. B: open channel I-V relationship: after activating IA with a 3-ms voltage step to +50 mV from a holding potential of −80 mV, membrane potential was stepped to various values between +40 and −70 mV where decaying currents were recorded. C: activation: current amplitudes from the II-V are plotted against test voltage. The voltage-dependence of IA channel activation was determined by dividing peak current amplitudes derived from the steady-state I-V by corresponding values from the II-V. These values were plotted as the fraction of open channels against voltage and fit by a Boltzmann function of the form: Fraction Open = 1/[1+exp(v½ − v)/k] where v½ is the voltage at which one half of the channels are in the open conformation and k is the slope factor. Curve was fit to data points at test potentials between −60 and +40 mV for n = 5. D: inactivation: the voltage-dependence of steady-state inactivation was measured by applying 10 s prepulses to potentials between −90 and −25 mV. Normalized current (means ± SE) for four cells was plotted against conditioning voltage and fitted with the equation I/IMAX = 1/[1 + exp(v − v½)/k] where IMAX is the current activated from a holding potential of −90 mV and v½ is the potential at which half of the channels are inactivated. E: voltage-dependent activation kinetics of IA: ascending portions of current traces from I-V protocols were fit with an equation of the form I = I∞[1 − exp(−Τ/τa)]N[exp(−Τ/τi)] where τa is the activation time constant, τi is the inactivation time constant, and N is an integer between 1 and 5. τa values at potentials from −40 to +50 mV are plotted as means ± SE for seven cells. Points relating τa and membrane voltage were fit with a single exponential. F: inactivation kinetics. IA currents were activated by voltage of varying size from a holding potential of −80 mV. Inactivation time constants (τi) were determined at each test potential by fitting the decaying phase of each current with a single exponential. τi values averaged from five cells are plotted against test voltage as means ± SE. Data were analyzed with least squares linear regression analysis to yield a line with slope of zero and intercept of 26.1 ± 0.4 ms. Number of independent experiments: n = 87 (A); n = 5 (B); n = 8 (C).

