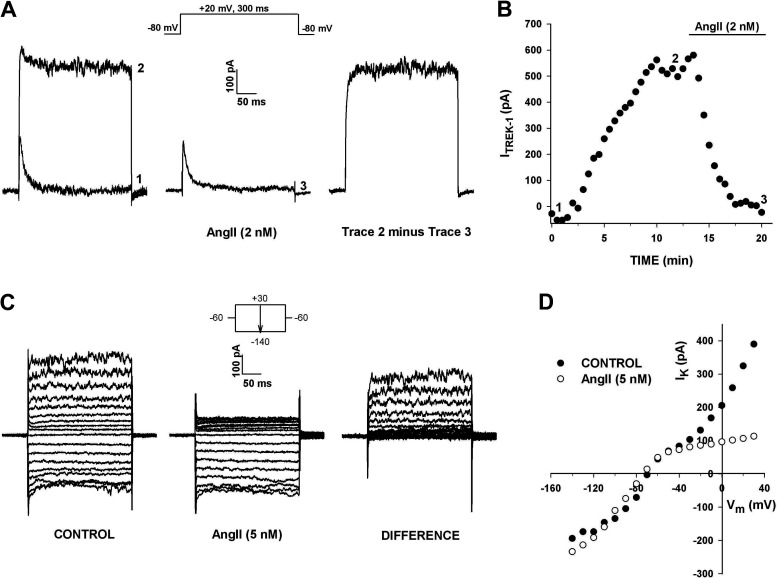
Figure 6.
Selective inhibition of K2P current by ANG II. Whole cell K+ currents were recorded in response to voltage steps to +20 mV applied at 30 s intervals from a holding potential of −80 mV before and after superfusing cell with 2 nM ANG II. A: current traces recorded immediately after initiating recording (1), when K+ current reached maximum amplitude (2), and after inhibition by 2 nM ANG II (3). Digital subtraction of trace 3 from trace 2 shows the ANG II -inhibited current. B: plot of current amplitudes, measured near the end of test pulse, against time. Numbers on graph correspond to those on traces in A. C and D: selective inhibition of K2P current. Effect of ANG II on K+ current I-Vs. K+ currents were recorded from human adrenal zona glomerulosa (AZG) cell in response to voltage steps between +40 and −140 mV, applied from a holding potential of −60 mV in 10 mV increments. C: traces show currents in standard saline (control), 5 nM ANG II, and the difference obtained by digitally subtracting currents in ANG II from control currents. D: I-V plots in control saline and after 5 nM ANG II. Current amplitudes before and after ANG II are plotted against test voltage. Number of independent experiments: n = 6 (A and B); n = 3 (C and D).

