Figure 11.
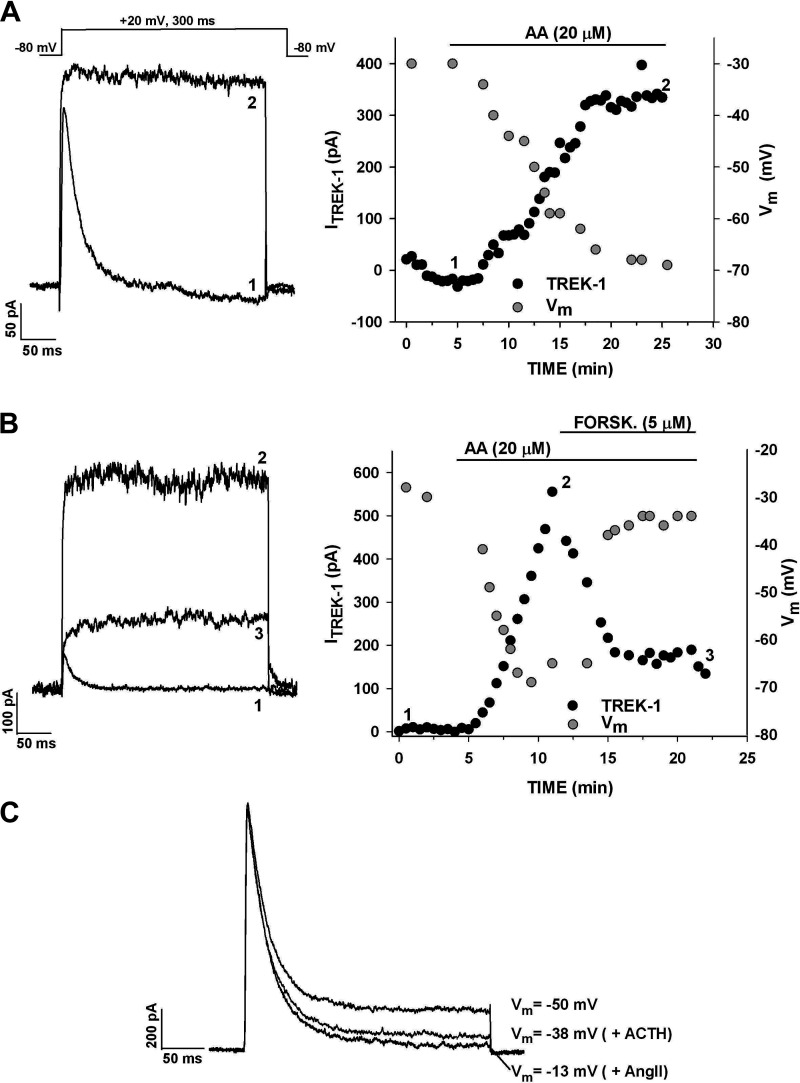
Effect of arachidonic acid and forskolin on TREK-1 and membrane potential. K+ currents were recorded in response to voltage steps to +20 mV applied at 30 s intervals from a holding potential of −80 mV. Membrane potential was recorded by switching to current clamp. A: current traces recorded before (1) and 20 min after (2) superfusing cell with 20 µM arachidonic acid (AA). Current amplitudes (black circles) and membrane potential (gray circles) are plotted against time. Numbers on plot correspond to those on current traces. B: current traces recorded in control saline (1), after 10-min exposure to 20 µM AA (2) and after 10-min exposure to 20 µM AA plus 5 µM forskolin (3). Current amplitudes (black circles) and membrane potential (gray circles) are plotted against time. Numbers on plot correspond to those on current traces. C: effect of ACTH and ANG II on K+ current and membrane potential. K+ currents were recorded in response to voltage steps to +20 mV from a holding potential of −80 mV. Cell was superfused with 500 pM ACTH followed by 5 nM ANG II. Current traces and corresponding membrane potential are shown. Number of independent experiments: n = 4 (A); n = 4 (B); n = 3 (C).

