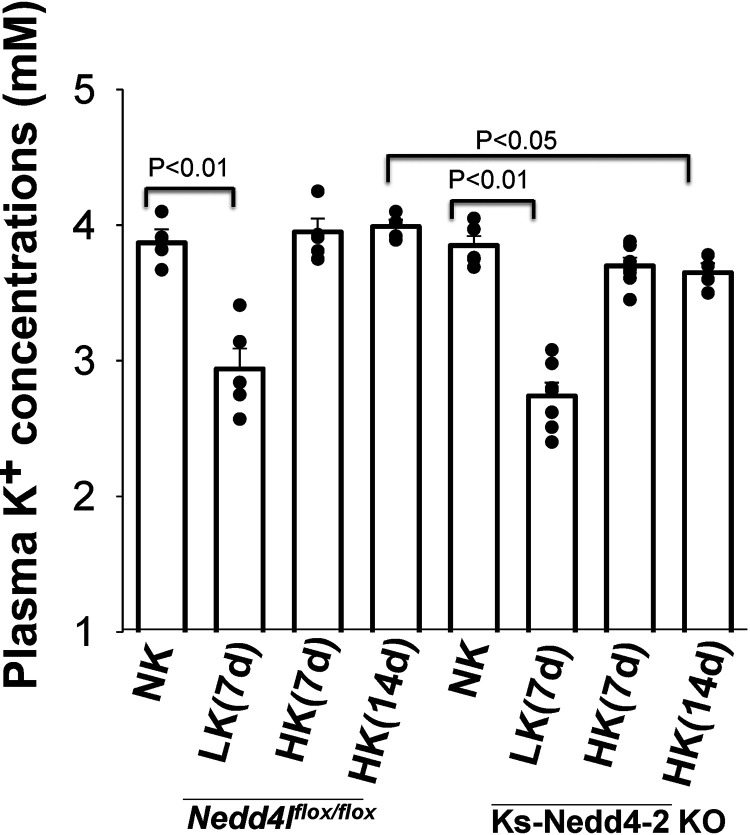
Figure 7.
Plasma K+ concentrations in kidney tubule-specific neural precursor cell expressed developmentally downregulated 4-2 knockout (Ks-Nedd4-2 KO) mice and floxed neural precursor cell expressed developmentally downregulated 4-like (Nedd4fl/fl) mice on different K+ diets. The bar graph shows plasma K+ concentrations in control mice [normal K+ (NK): n = 5 mice (3 male/2 female); low K+ (LK): n = 5 mice (3 male/2 female); high K+ (HK) for 7 days: n = 5 mice (3 male/2 female); and HK for 14 days: n = 4 mice (2 male/2 female)] and Ks-Nedd4-2 KO mice [NK: n = 5 mice (3 male/2 female); LK: n = 7 mice (4 male/3 female); HK for 7 days: n = 7 mice (4 male/3 female); and HK for 14 days: n = 4 mice (2 male/2 female)]. Individual data points are indicated by black circles. Significance was determined by two-way ANOVA.

