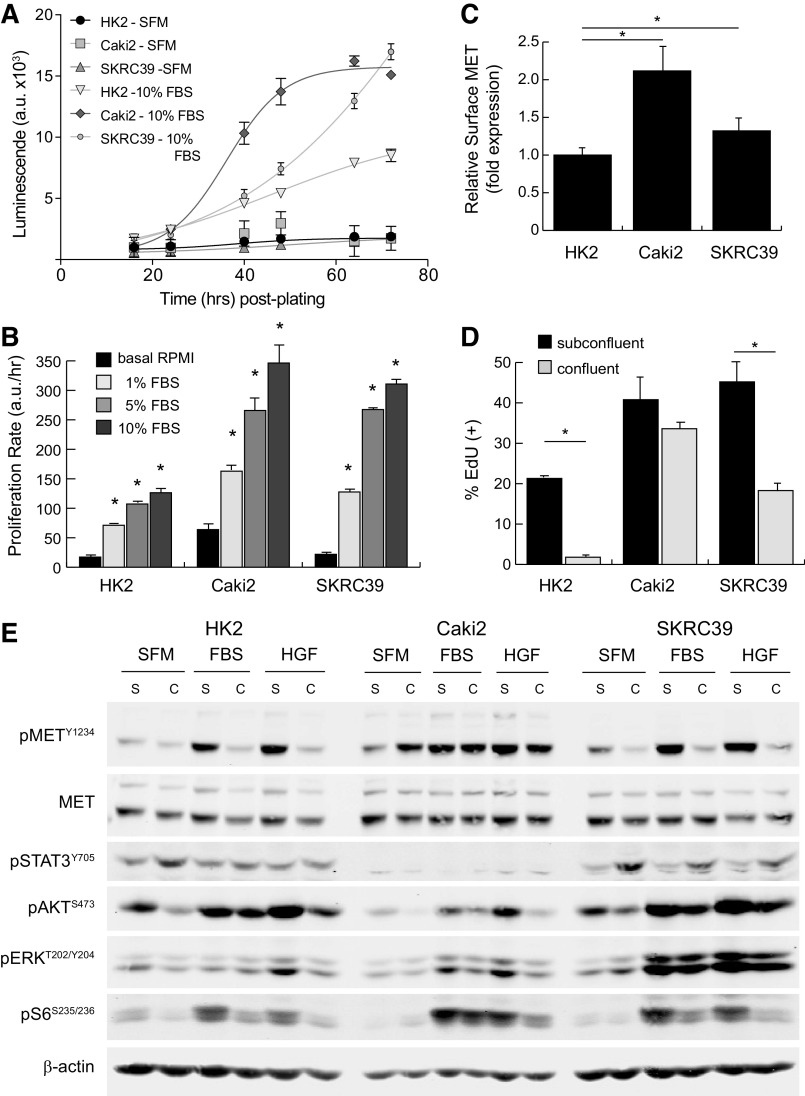
Figure 1.
Characterization of MET activation in standard renal cell monocultures. The renal cell models used in this project included normal immortalized proximal tubule epithelia (HK2) and two papillary renal cell carcinoma lines (Caki2 and SKRC39). A: the proliferation rate of each cell line was measured using a Cell Titer Glo luminescence assay in serum-free media (SFM) or in media with 10% FBS. Luminescent values in arbitrary units (a.u.) were captured from quadruplicate wells at regular intervals for 72 h and fit to exponential growth equations to obtain growth rates. B: the proliferation rate of each cell line in four different media conditions (basal, 1% FBS, 5% FBS, and 10% FBS) was measured using the assay described in A. The significance of the growth rate in FBS was determined for each cell line relative to its proliferation rate in basal media without serum (*P < 0.05). C: cell surface expression of MET was measured by flow cytometry for each of the three cell lines and normalized to HK2 cell expression. Data represent averages of four separate assays with error bars representing the standard deviation of these experimental replicates. D: cell cycle entry of renal lines under subconfluent and confluent conditions as measured by 5-ethynyl-deoxyuridine (EdU) incorporation. Data represent the average of three biological replicates with error bars representing the standard deviation (*P < 0.05). E: representative immunoblot analysis of cells treated with 5% FBS or 100 ng/mL recombinant human hepatocyte growth factor ligand for 15 min. Cells were cultured under subconfluent (S) or fully confluent (C) conditions to evaluate contact inhibition of signal transduction. Activation of MET is indicated by phosphorylation at tyrosine 1234 (pMETY1234). Transmission of signals from activated receptors to their downstream pathways was determined by evaluating the phosphorylation of STAT3, AKT, ERK, and ribosomal S6 protein at the indicated sites. Detection of β-actin was included as a loading control for each sample.

