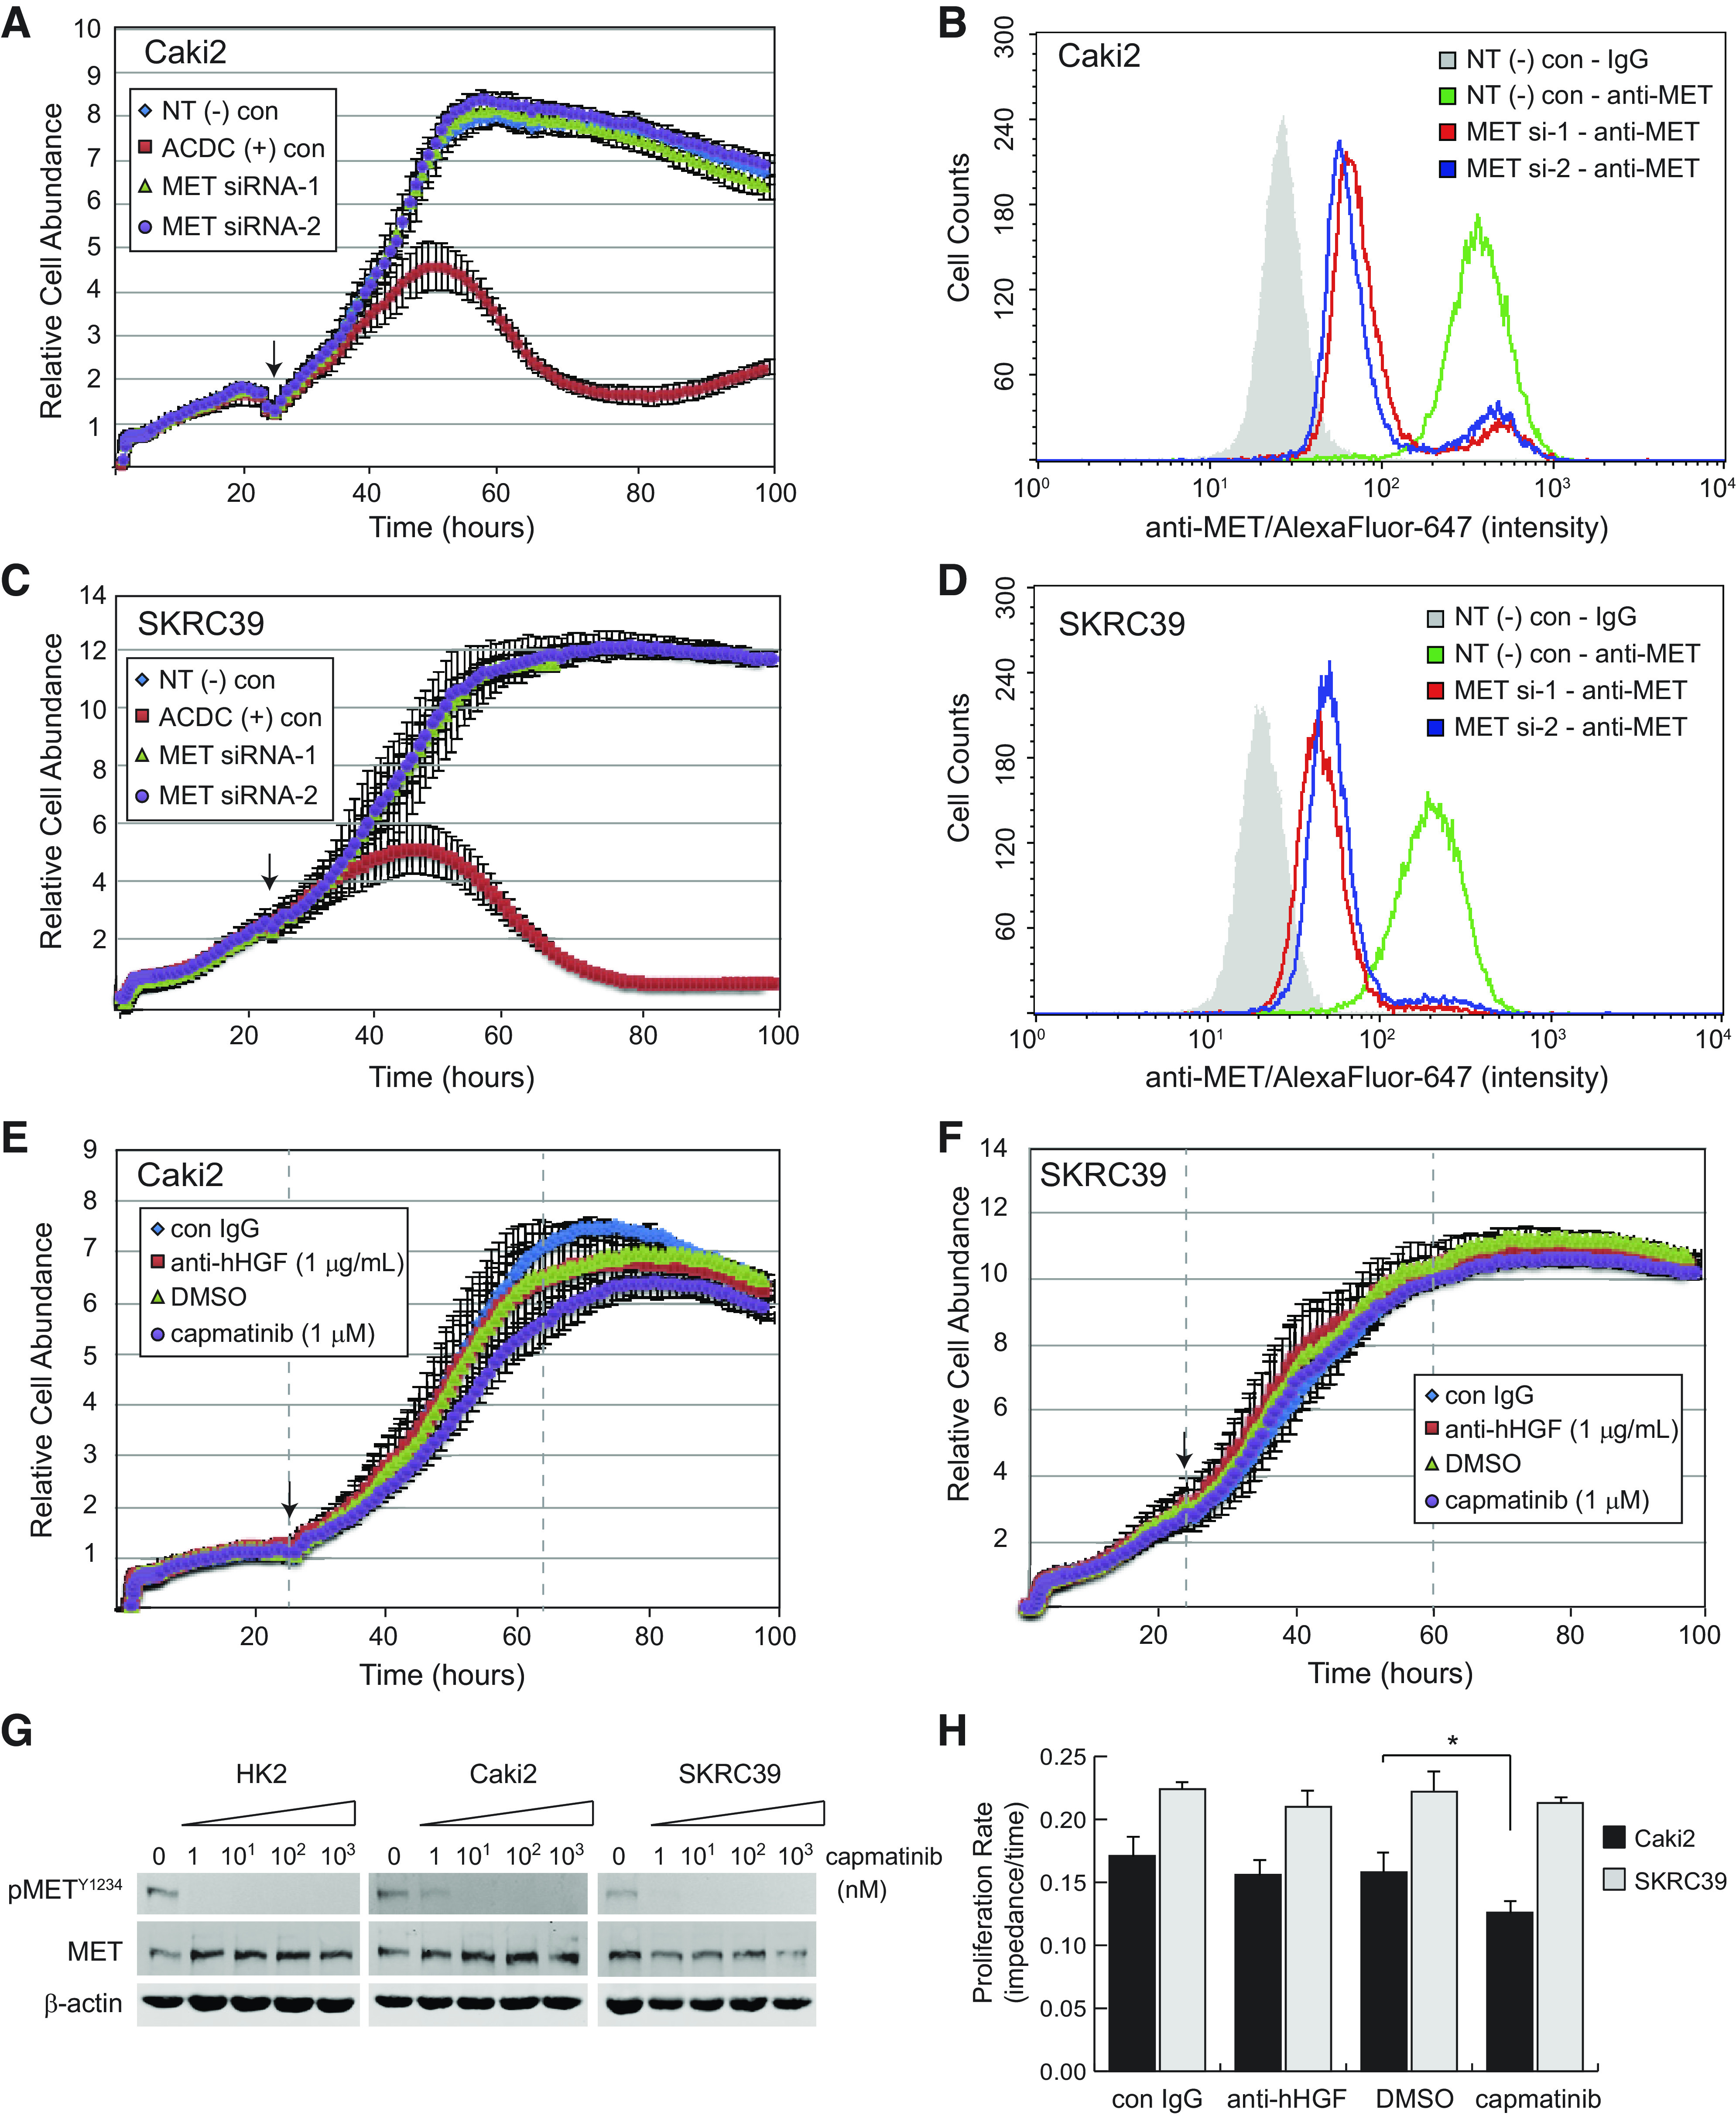
Figure 2.

Inhibition of human hepatocyte growth factor (hHGF)/MET signaling in standard two-dimensional monoculture fails to impact papillary renal cell carcinoma cell proliferation. A, C, E, and F: Caki2 or SKRC39 cell proliferation was continuously monitored using the xCELLigence real-time cell analysis system for 110 h. The arrow on each figure indicates the 24-h time point at which siRNA transfection (A and C) or addition of the indicated drug (E and F) was performed. B and D: flow cytometry histograms of MET expression in control or MET knockdown lines to validate effective siRNA silencing of MET. Negative control cells were stained with mouse isotype IgG to establish the background signal for the assay (gray shaded histogram). G: immunoblot analysis of cells treated with the indicated nanomolar concentrations of capmatinib for 24 h in complete media containing 5% FBS. Activation of MET is indicated by autophosphorylation at tyrosine 1234 (pMETY1234); actin was included as a loading control for each sample. H: proliferation rates measured as the linear slope (impedance/time) of curves between the gray dashed lines in E and F. The significance of growth rate change was determined for each cell line relative to its matching negative control condition (*P < 0.05). ACDC, cell death positive control; con, control; NT(−), nontargeting negative control.
