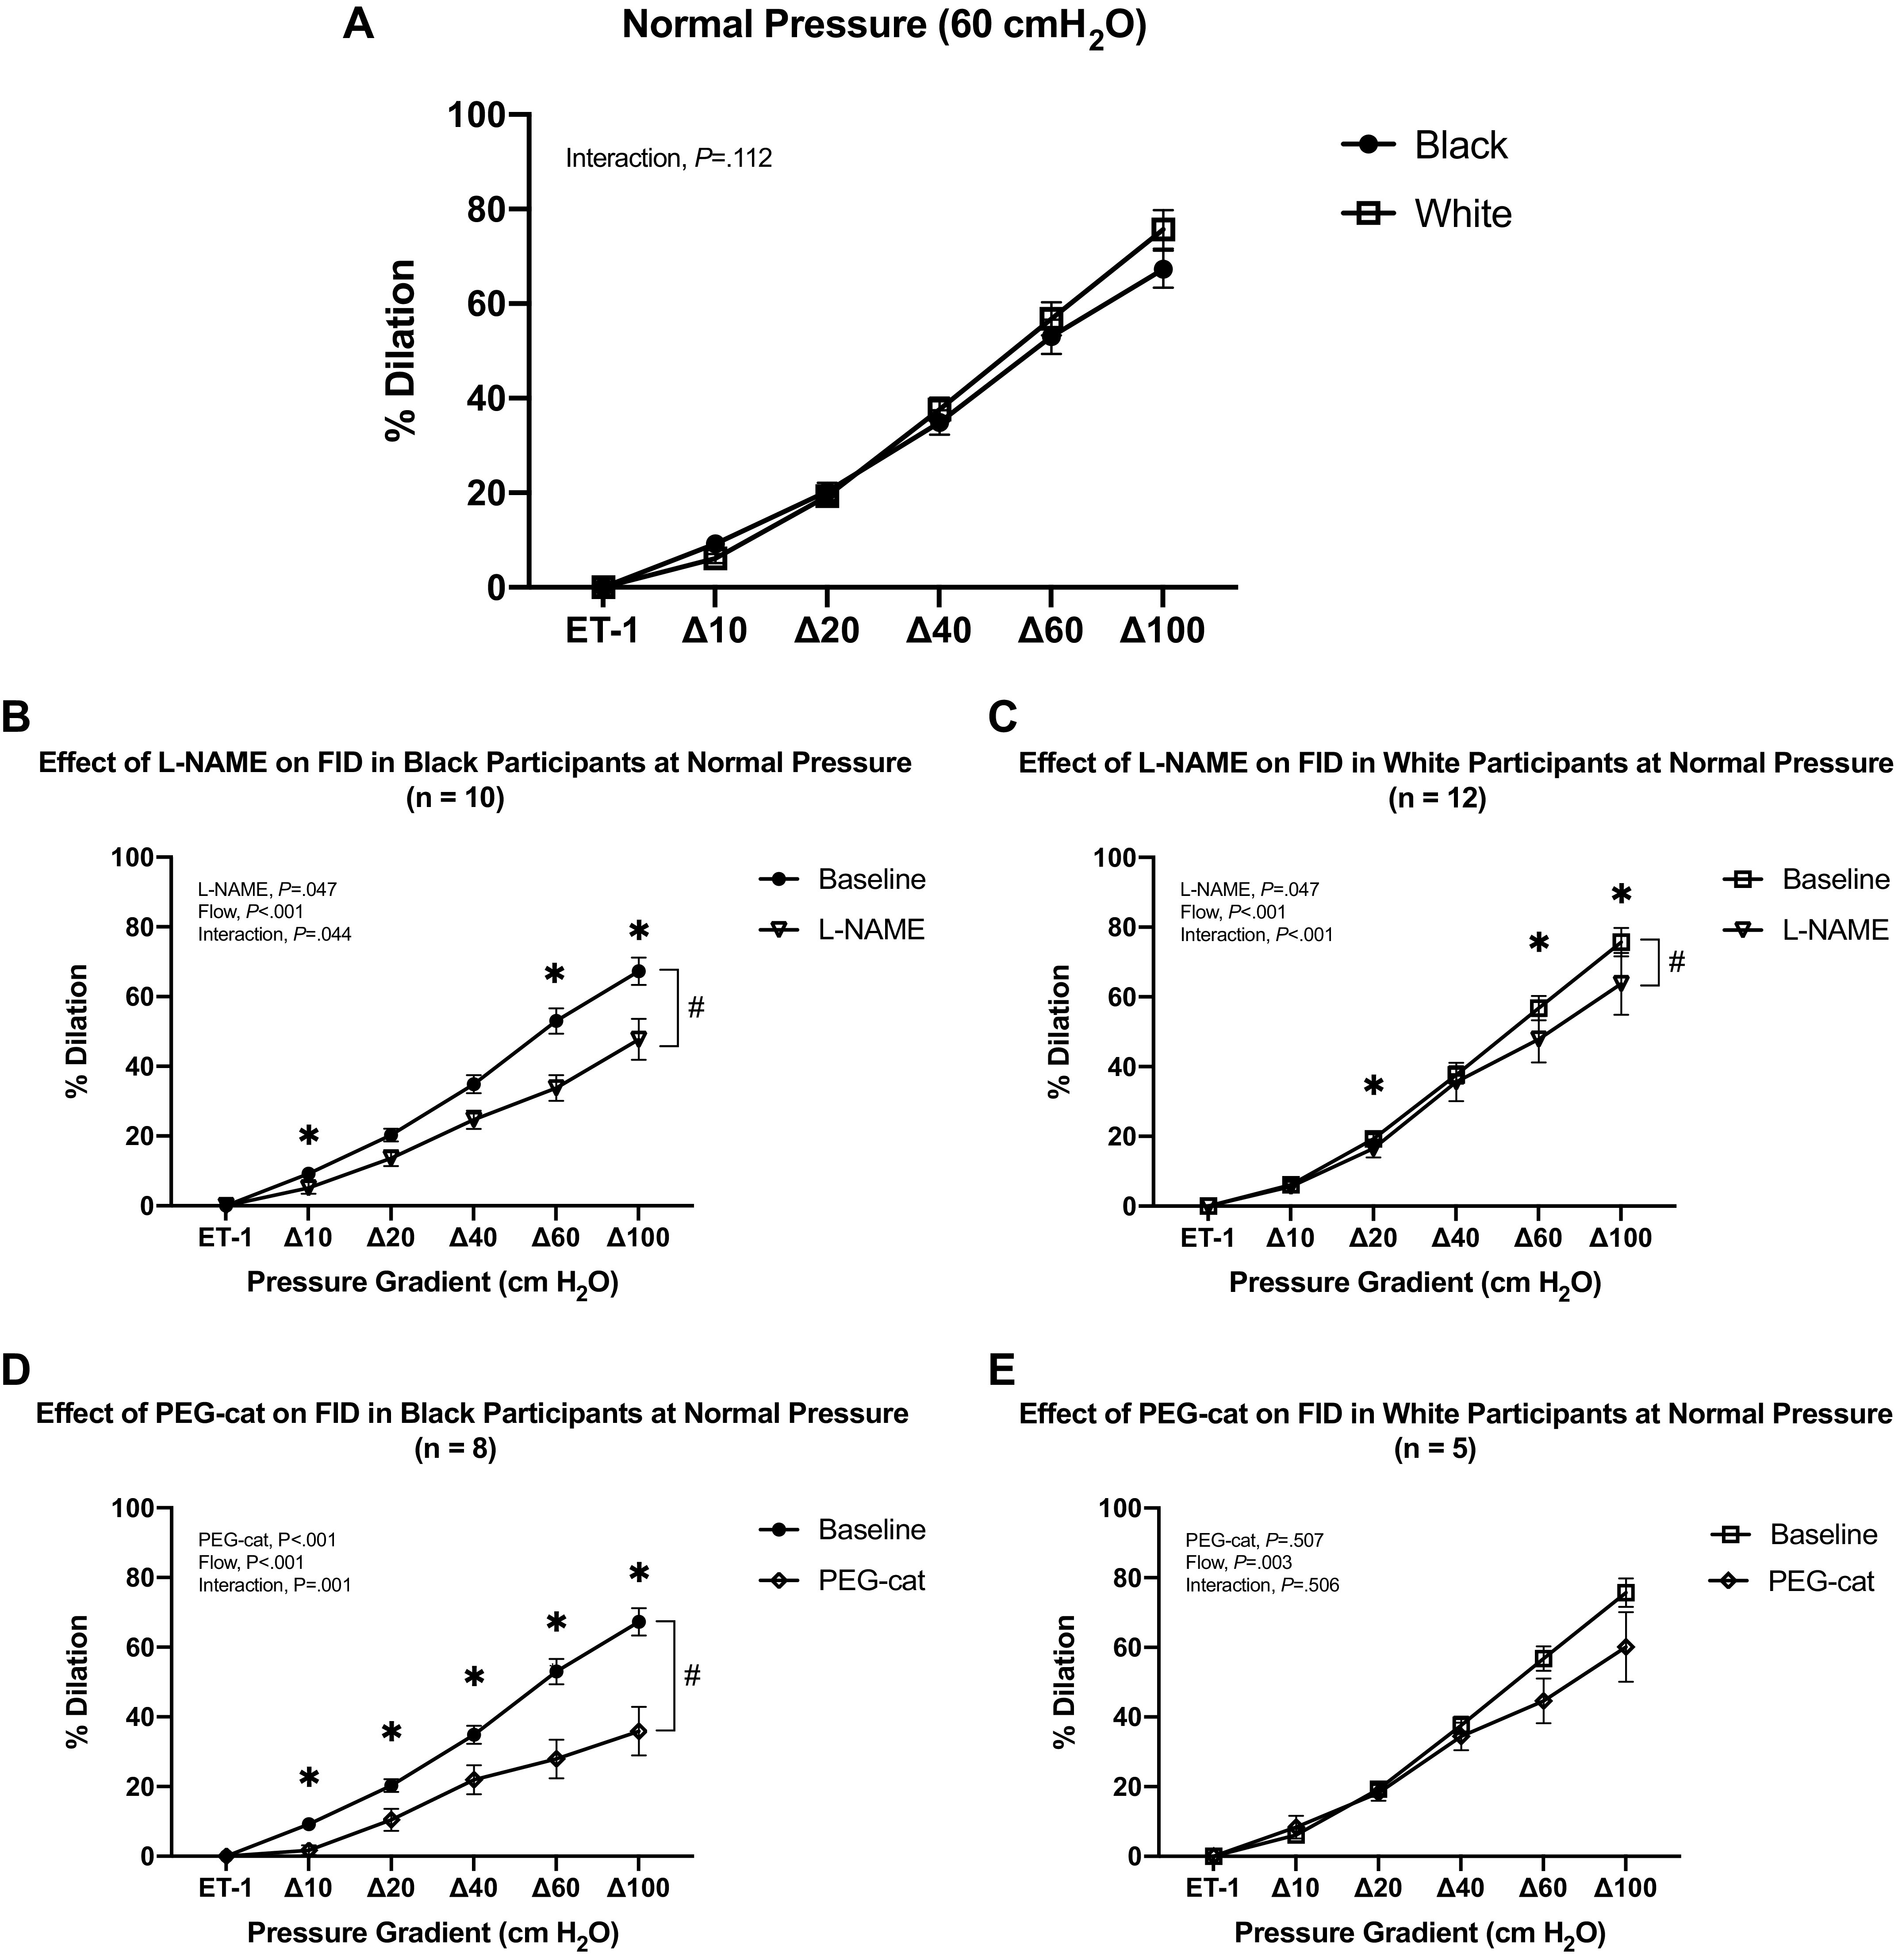
Figure 1.

Resistance vessel FID responses between black and white participants at normal intraluminal pressure (60 cmH2O). A: comparing FID responses in vessels from black and white participants at normal intraluminal pressure (60 cmH2O). B: comparing FID responses in resistance vessels from black participants before and after incubation with l-NAME at normal intraluminal pressure (60 cmH2O) (*, #P < 0.05). C: comparing FID responses in resistance vessels from white participants before and after incubation with l-NAME at normal intraluminal pressure (60 cmH2O) (*, #P < 0.05). D: comparing FID responses in resistance vessels from black participants before and after incubation with PEG-cat at normal intraluminal pressure (60 cmH2O) (*, #P < 0.05). E: comparing FID responses in resistance vessels from white participants before and after incubation with PEG-cat at normal intraluminal pressure (60 cmH2O). Data are means ± SE. FID, flow-induced dilation; l-NAME, NG-nitro-l-arginine methyl ester; PEG-cat, polyethylene glycol-catalase.
