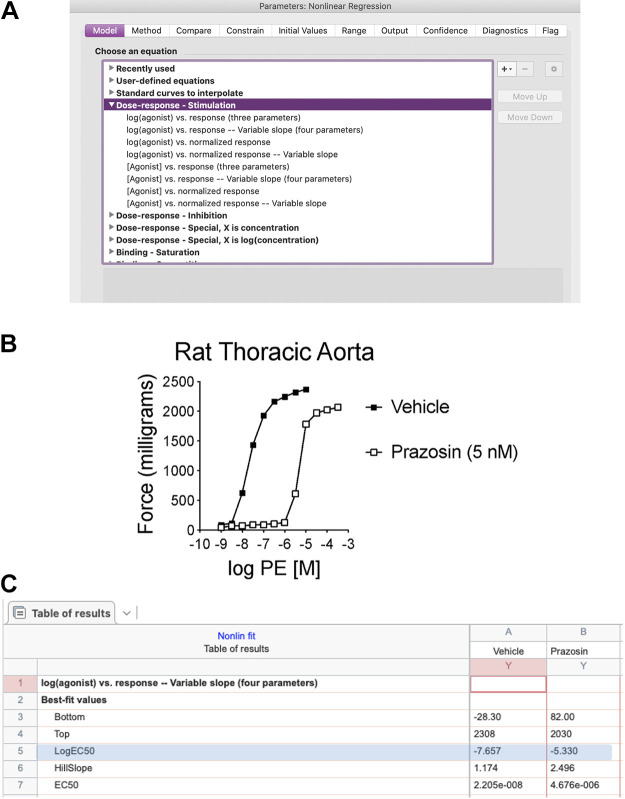
Figure 21.
GraphPad Prism software allows a number of different methods for analyzing sigmoidal pharmacological curve (A). Concentration-response curve to phenylephrine (PE) in the presence or absence of Prazosin (alpha-1 antagonist, 5 nM) in rat thoracic aorta (B). GraphPad Prism software presents the option of Log (agonist) vs. response—variable slope (four parameters) (C), to calculate data that are derived from the antagonist experiment in B.

