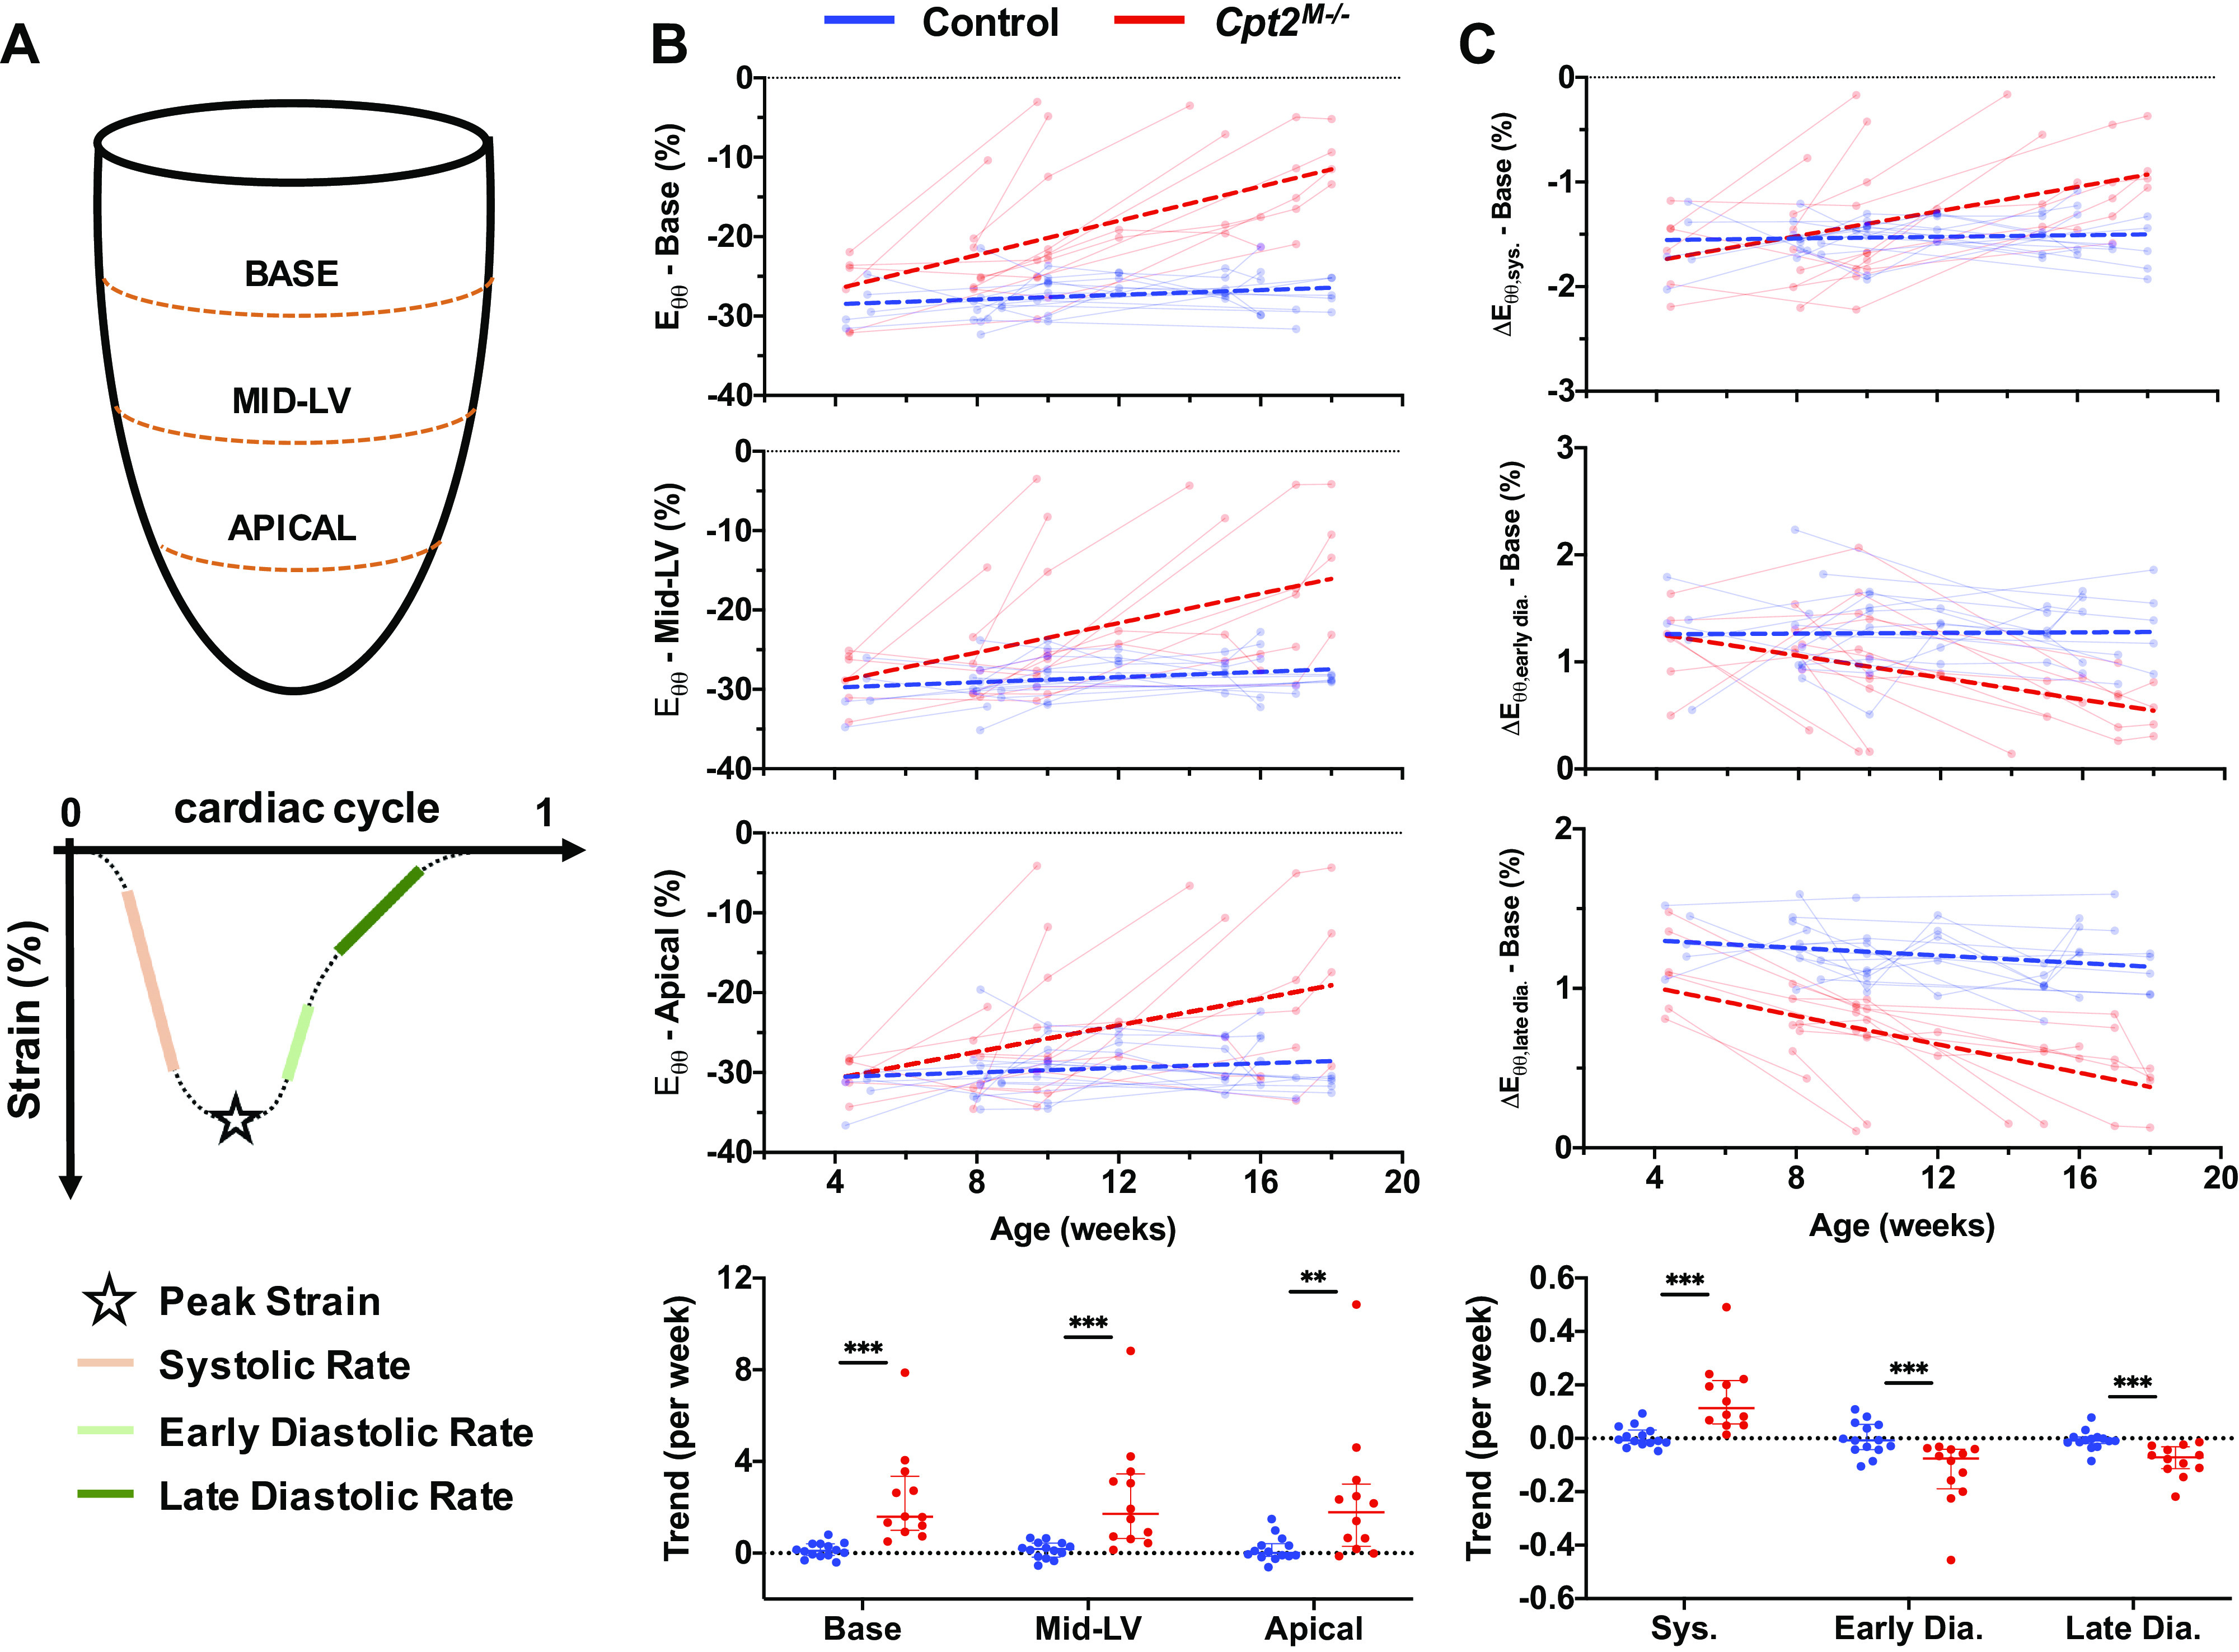
Figure 4.

Regional circumferential strain measurements. A: schematic of where across the left ventricle circumferential strain was measured, and how peak strain (Eθθ), systolic strain rate (ΔEθθ,sys), early diastolic strain rate (ΔEθθ,early dia), and late diastolic strain rate (ΔEθθ,late dia) were defined on a representative strain curve. B: serially measured peak circumferential strain is shown for the base, mid-ventricle (Mid-LV), and apical slices, with data from control mice (n = 14) shown in blue and Cpt2M−/− mice (n = 12) shown in red. Points from the same mouse are shown connected, and linear regression performed on across each cohort is visualized with thick dashed lines. Comparison plots of strain trends from each mouse and region are shown (bottom), with horizontal lines designating median and interquartile ranges. Significance markers above each comparison plot indicate P value level from nonparametric Mann–Whitney tests (***P < 0.001; **P < 0.01). In addition, example plots of aging-based measurements, and trend comparisons, are provided for systolic (sys.), early diastolic (early dia.), and late diastolic (late dia.) strain rates at the base of the heart (C).
