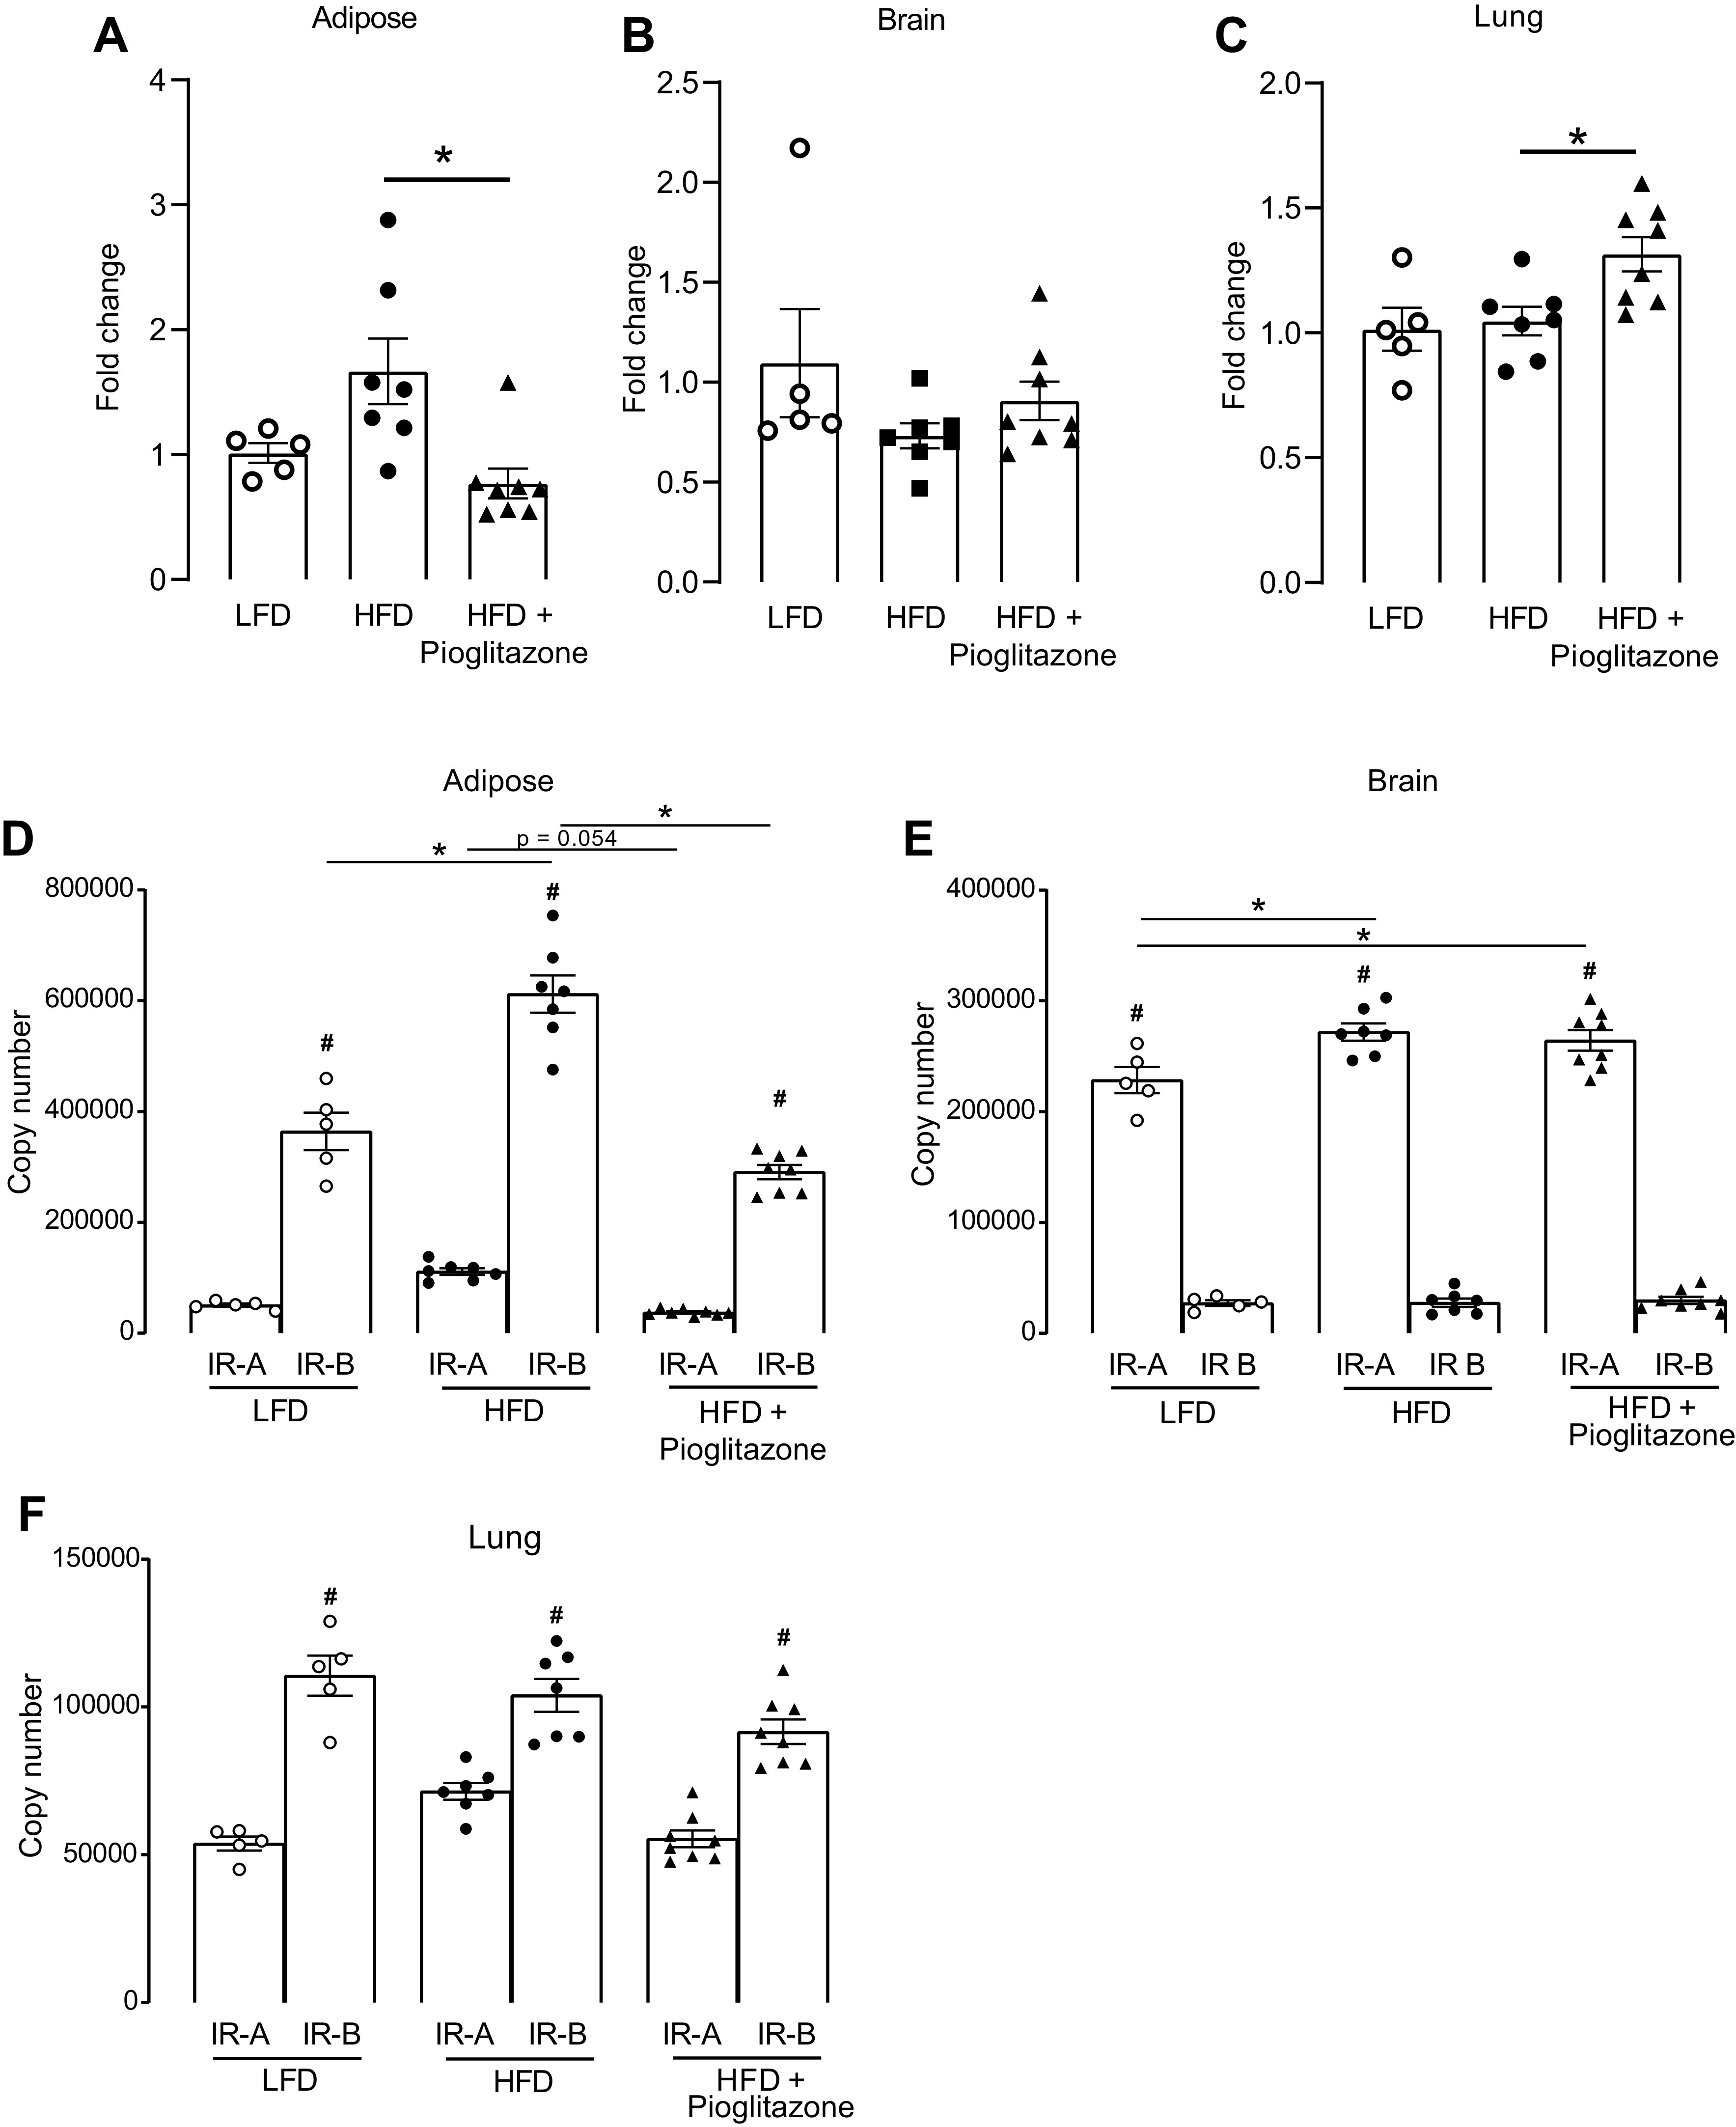
Figure 7.

Quantification of total insulin receptor and insulin receptor isoform mRNA expression. Adipose, brain, and lung tissues were collected from rats that were fed either a low-fat diet (LFD) or a high-fat diet (HFD) and treated with pioglitazone (3 mg/kg) or PBS by daily gavage for 5 wk. mRNA was isolated from adipose (A and D), brain (B and E), and lung (C and F) tissue. Total insulin receptor expression (A–C), insulin receptor isoform A (IR-A), and insulin receptor isoform B (IR-B) mRNA expression (D–F) were quantified using real-time RT-PCR. n = 5–8. *P < 0.05 between treatment groups; #P < 0.05 between IR-A and IR-B within the same treatment group.
