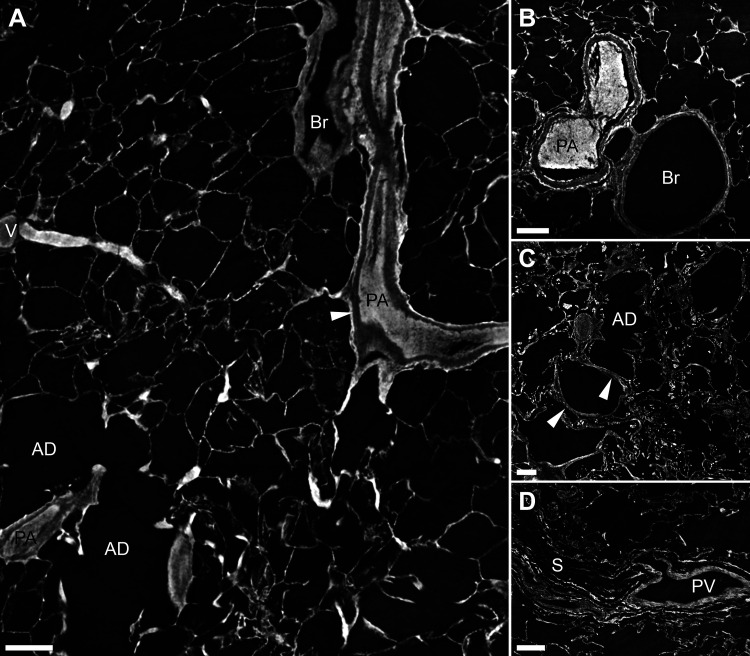
Figure 1.
Normal lung imaged with synchrotron-based phase-contrast micro-CT. A: a bronchovascular bundle with a pulmonary artery (PA) and a bronchiole (Br) is seen to the right. The resolution allows for individual layers of the vascular wall to be discerned (white arrowhead). To the left, a vein (V) that collects oxygenated blood is shown, and below the vein two alveolar ducts (AD). Supplemental Video S1 scans through the 3-D volume from which the 2-D image in A has been captured. B: a cross section of a bifurcating muscular pulmonary artery (PA) and a bronchiole (Br). C: a longitudinal virtual section of an alveolar duct (AD) is shown. The white arrowheads mark small vessels within the wall of the alveolar duct. D: a pulmonary vein (PV), positioned within a septa (S) as expected. Scale bars in A–D = 200 µm. 2-D, two-dimensional; 3-D; three-dimensional.

