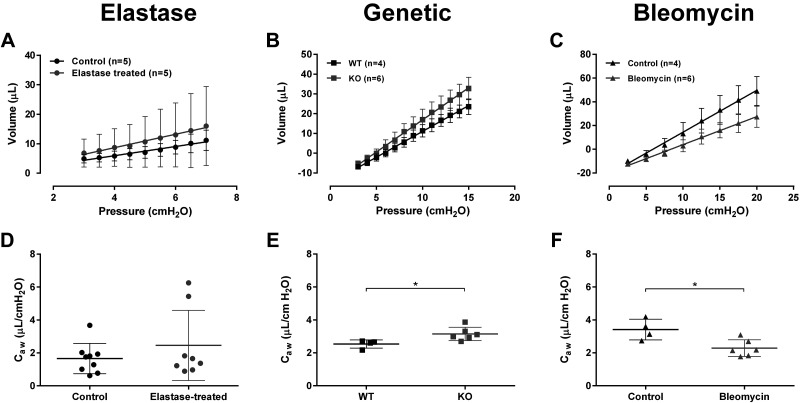
Figure 3.
Determination of airway compliance. A–C: average (±SD) pressure-volume (PV) inflation curve segments for the determination of airway compliance. A: control (n = 5) and elastase-treated mice (n = 5). B: wild-type (WT, n = 4) and leukotriene C4 synthase knockout (KO, n = 6) mice. C: control (n = 4) and bleomycin-treated (n = 6) mice. In the elastase-induced model of emphysema (A), only the curves from the animals subjected to the automated method (flexiVent FX) were included (3). D–F: airway compliance (Caw) calculated by linear regression as the slope of the PV inflation segment. Individual results (n = 4–9/group) and group means (±SD) are presented for each group. *P < 0.05, t test.

