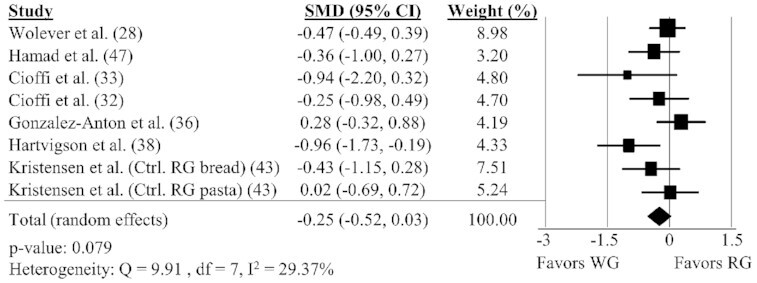
FIGURE 6.

Forest plot of the meta-analysis on the effect of WG intake on prospective consumption in adults. Values are the standardized mean differences (SMDs) for prospective consumption AUC between WG intake and RG intake (32, 33, 36, 38, 43, 47, 61). Ctrl., control; RG, refined grain; var. variety; WG, whole grain.
