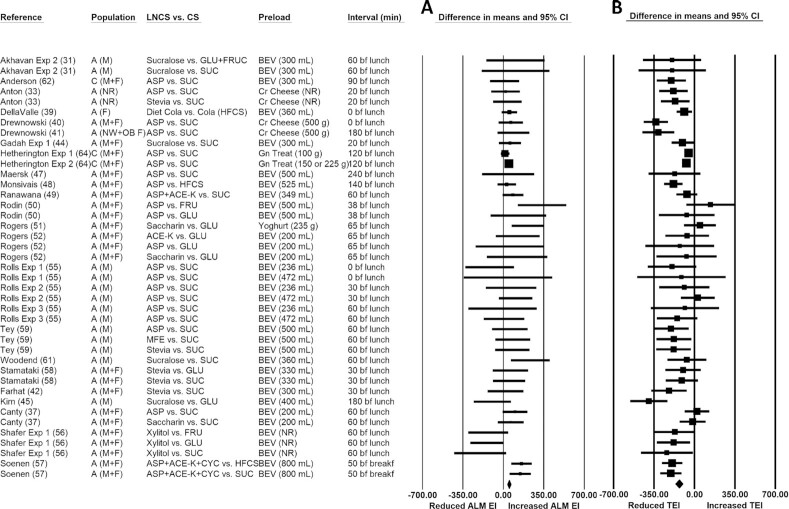
FIGURE 3.
Forest plot of the ad libitum meal (A) and total (preload + ALM) (B) energy intakes with consumption of LNCS- versus CS-sweetened preloads. Each square symbol is proportional to the weight of the comparison. The diamond represents the pooled effect. EIs at the ALM were significantly greater (by ∼58.5 kcal; 95% CI: 35.4, 81.7 kcal; P < 0.001) following the consumption of LNCS- versus CS-sweetened preloads (forest plot A). However, total energy intake (from the preload + ALM) was significantly lower (by ∼ −132.4 kcal; 95% CI: −163.2, −101.6 kcal; P < 0.001) (forest plot B). A, adults; ALM, ad libitum meal; ACE-K, acesulfame potassium; ASP, aspartame; BEV, beverage; bf, before; breakf, breakfast; C, children; Cr, cream; CS, caloric sweetener; CYC, cyclamate; EI, energy intake; Exp, experiment; F, females; FRU, fructose; GLU, glucose; Gn, gelatin; HFCS, high-fructose corn syrup; LNCS, low-/no-calorie sweetener; M, males; MFE, monk fruit extract; NR, not reported; NW, normal-weight; OB, obese; SUC, sucrose; TEI, total energy intake.

