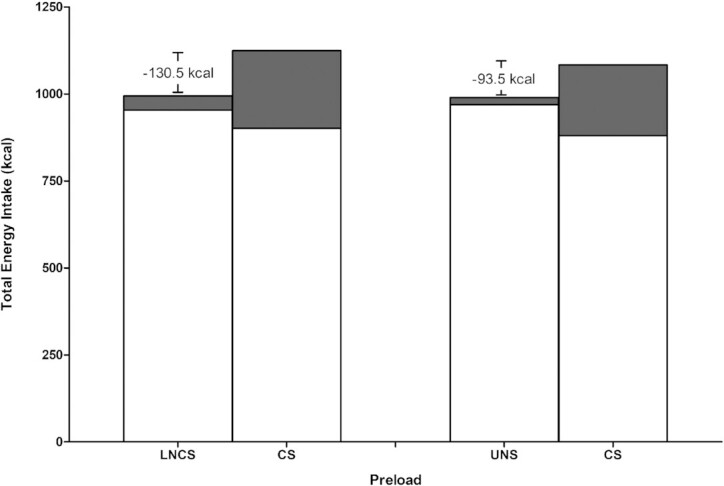
FIGURE 5.

Graphical representation of the energy intakes with consumption of LNCS- versus CS-sweetened preloads and UNS versus CS-sweetened preloads. The white portion of bar represents the energy intake from the ad libitum meal and the gray portion of the bar represents the energy content of the preload. The numerical energy difference noted is of differences in total energy intake (from the preload + ad libitum meal) between the 2 preload conditions. CS, caloric sweetener; LNCS, low-/no-calorie sweetener; UNS, unsweetened.
