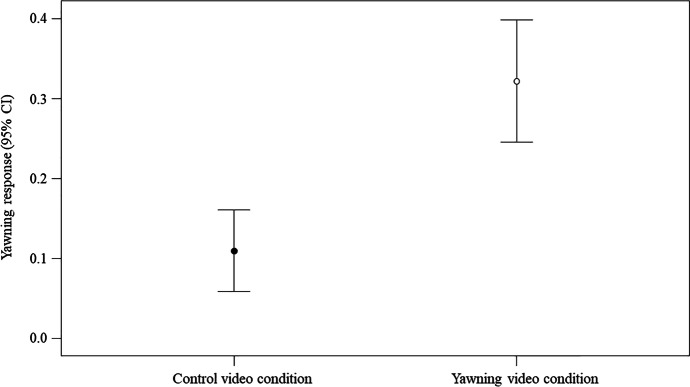
Fig. 2.
Effect of the type of the video condition (yawning/control) on the yawning response (experimental setting). Line plot showing the yawning response (Y axis) in the experimental setting as a function of the condition (yawning/control; X axis). The presence of a yawning response was significantly more likely in the yawning (M = 0.3322; SE = 0.039) than in the control (M = 0.120; SE = 0.026) condition (statistical results: Table 1), which confirms the presence of yawn contagion. Mean (circle) and 95% confidence interval (bars) are indicated

