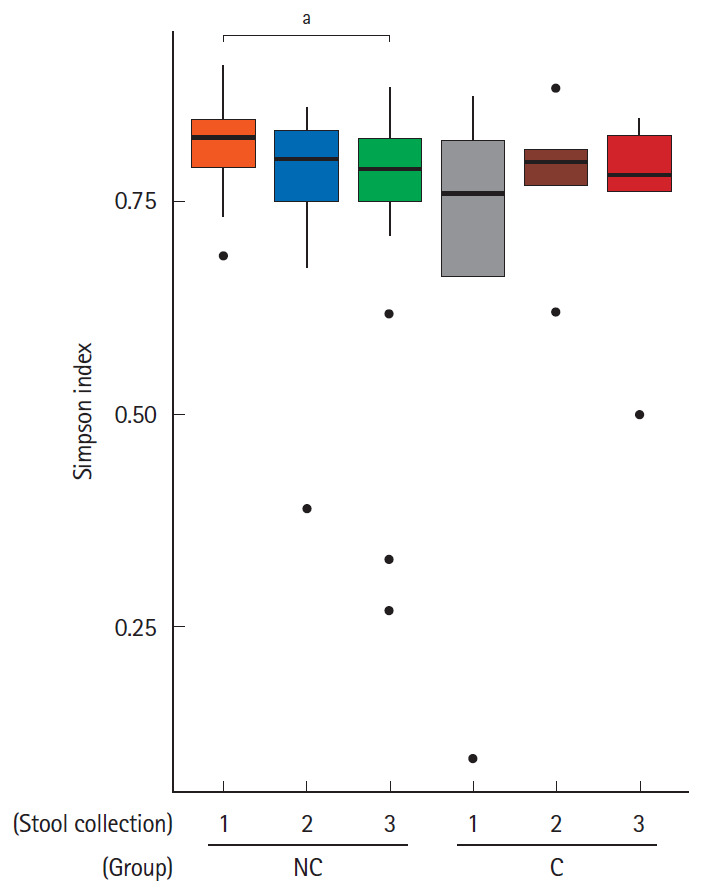
Fig. 1.

Box plot for the alpha-diversity of bacterial communities in the 2 groups–no complication group (NC) and complication group (C)–according to the timing of the stool collection (1, before bowel preparation; 2, on the 7th day after colonoscopy; 3, on the 28th day after colonoscopy). The box plot presents the full range of values obtained from the source data. The ggplot of the R software package was used for visualization (aP<0.05).
