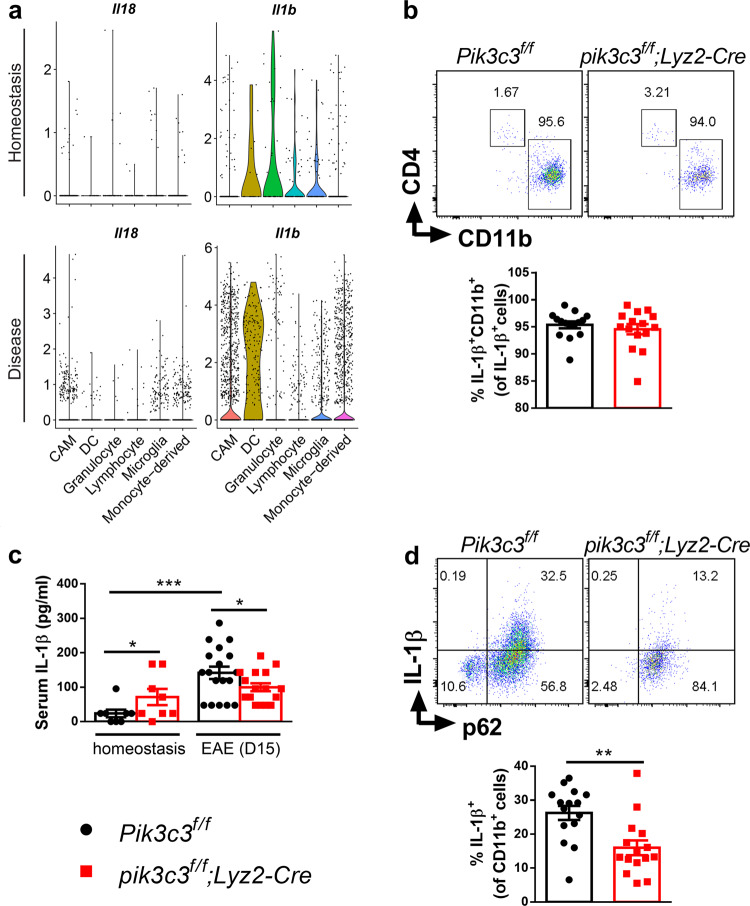
Fig. 7. Pik3c3 deficiency in myeloid cells inhibits EAE-induced IL-1β production in the CNS.
a Violin plots of Il1b and Il18 gene expression distribution of different cell clusters at homeostasis or nonhomeostasis states (preclinical, onset, and acute EAE). The original data for this figure were retrieved from ref. 28 and reanalyzed as described in “Materials and methods”. b At day 15 post EAE induction, CNS IL-1β+ cells were analyzed for expression of CD11b and CD4. Results from at least three independent experiments were pooled and plotted as mean ± SEM. c Quantification of serum IL-1β levels measured by ELISA. d IL-1β production from CNS cells. Cells were taken from the CNS and IL-1β-producing and p62-expressing CD11b+ cells were assessed. Results from at least three independent experiments were pooled and plotted as mean ± SEM. *P < 0.05, **P < 0.01, ***P < 0.001.

