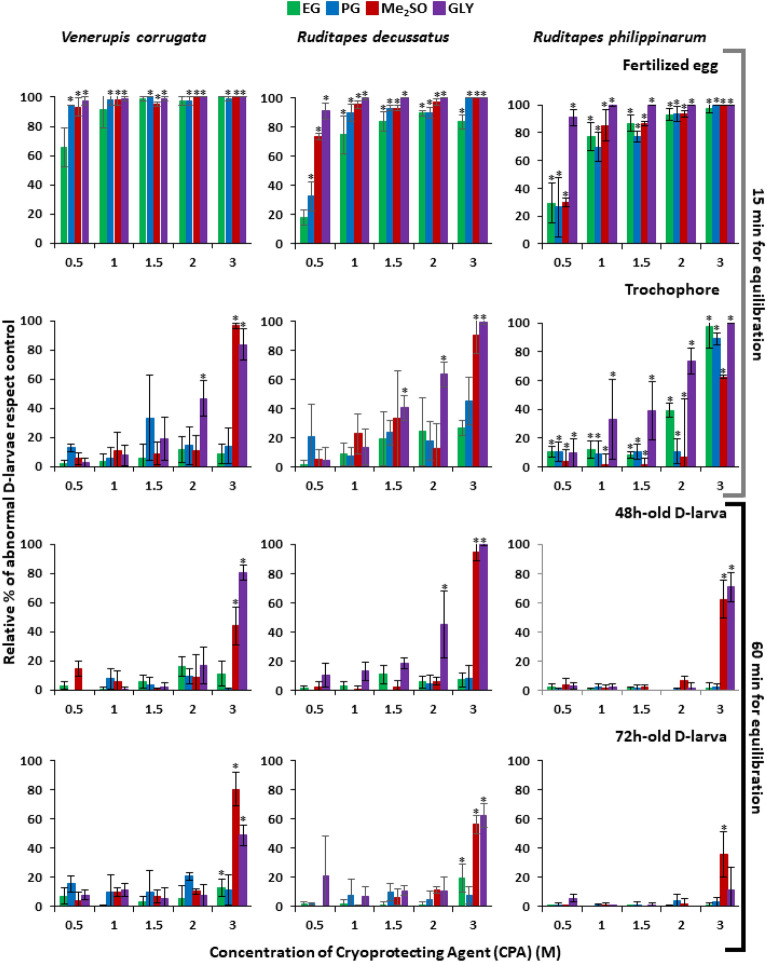
Figure 3.
Percentage of abnormal D-larvae compared to control group developed from development stages of Venerupis corrugata, Ruditapes decussatus and Ruditapes philippinarum (fertilized egg, trochophore, 48 and 72 h-old D-larva) exposed to increasing concentrations of ethylene–glycol (EG), propylene-glycol (PG), dymethil-sulfoxide (Me2SO) and glycerol (GLY). Results are expressed as mean ± standard deviation (SD), n = 3. Asterisk shows statistical differences with control assessments (p˂0.05). This parameter has been calculated as the division between the percentage of abnormal D-larvae calculated divided by the abnormality percentage showed in controls. Abnormality in controls was in general below 25% and the average percentage of abnormality was 16 ± 7.9.

