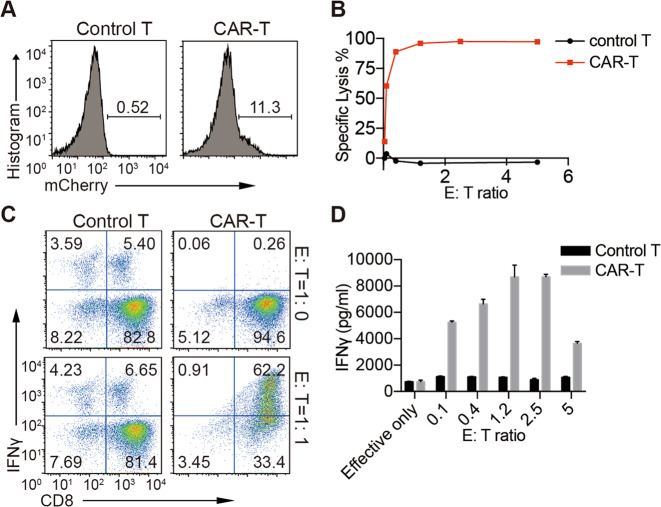
Fig. 1.
CAR-T cell construction. a Flow cytometry showing mCherry-CAR expression on mouse primary T cells 2 days after transduction. b–d Effector cells, sorted CAR-T cells cultured for another 3–5 days; target cells, freshly sorted splenocytes labeled with CellTrace Violet. After coculture at the indicated ratios for 4 h, the percentage of lysed B cells (b) and levels of intracellular IFNγ expressed by effector cells (c) were analyzed by flow cytometry. d The supernatant IFNγ concentration after 24 h of coculture was analyzed by ELISA. The data are representative of at least two independent experiments with similar results

