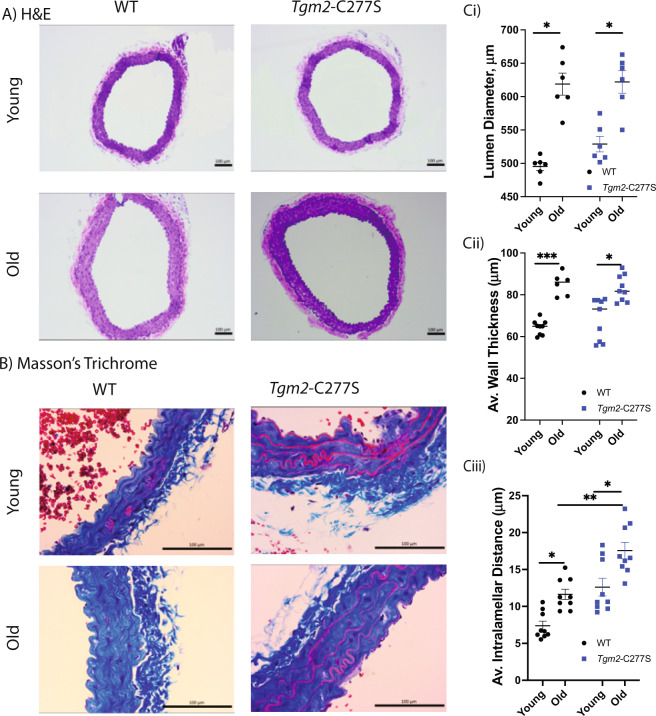
Fig. 7. Histochemical analysis of aorta from young and old mice.
A, B Representative hematoxylin and eosin (A) and Masson’s trichrome (B) staining of cross-sections of the aorta. C Bar graphs of Lumen diameter (i), wall thickness (ii), and intralamellar distance (iii) in aorta from old and young littermate WT and Tgm2-C277S mice; (n = 5 mice per cohort; *p < 0.05, **p < 0.01, ***p < 0.001 by ordinary one-way ANOVA with Bonferroni post hoc analysis).

