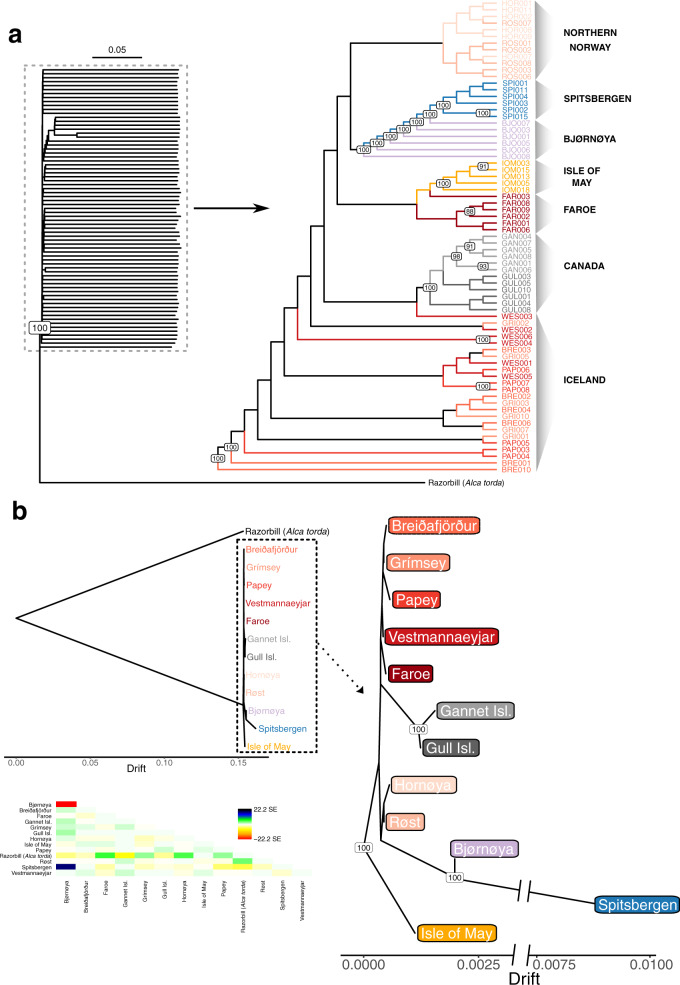
Fig. 2. Phylogenetic reconstruction of individual and colony relationships from 71 Atlantic puffin individuals sampled across 12 colonies throughout the species’ breeding range.
a An individual-based neighbor-joining tree constructed using pairwise p-distances calculated from genotype likelihoods at 1,093,765 polymorphic nuclear sites. Branch lengths and the outgroup were removed for the zoomed-in section to improve visualization. b A population-based maximum likelihood Treemix analysis using allele frequencies at the same 1,093,765 polymorphic nuclear sites as in (a). Both trees are rooted using the razorbill as an outgroup. The tree in (b) is visualized with and without the outgroup. Branch lengths are equivalent to a genetic drift parameter. The heatmap indicates the residual fit of the tree displaying the standard error of the covariance between populations. In (a) and (b), the color coding of the colonies is consistent with those in Fig. 1 and node labels show bootstrap support >80. The dataset(s) needed to create this Figure can be found at 10.6084/m9.figshare.14743299.v1.

