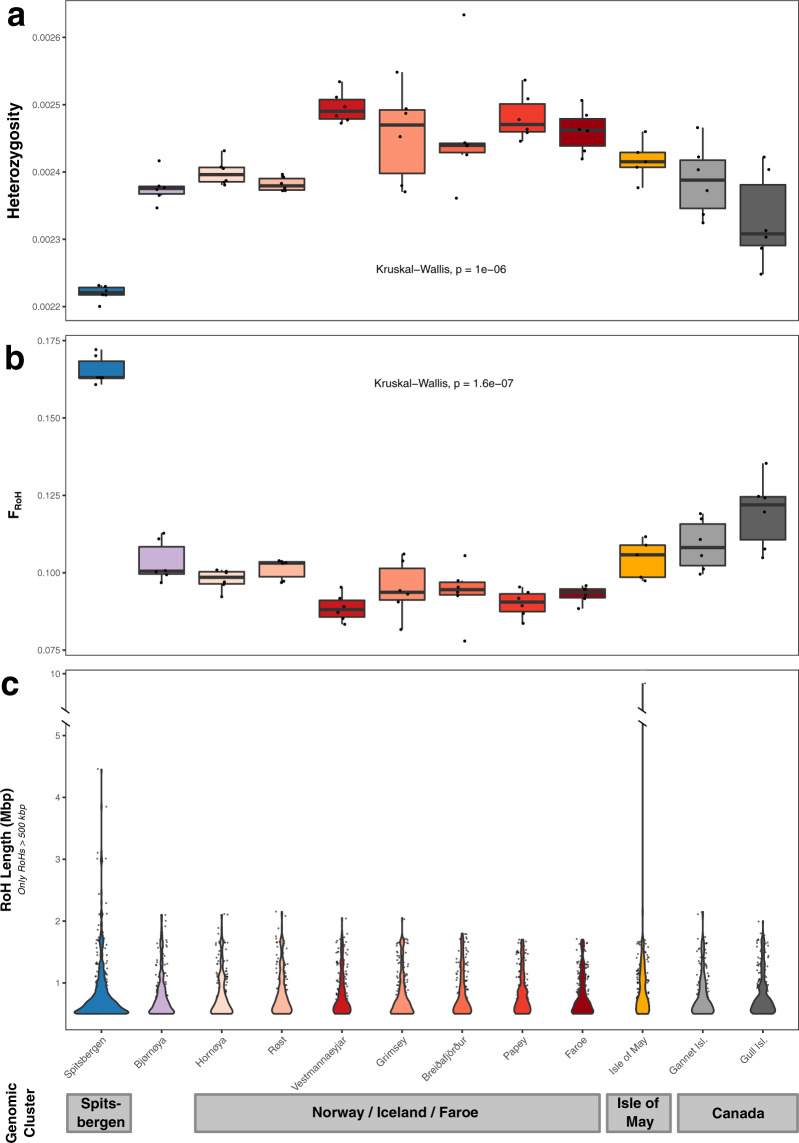
Fig. 3. Genome-wide heterozygosity, inbreeding, and Runs-of-Homozygosity (RoH) compared between 12 Atlantic puffin colonies across the species’ breeding range.
a Estimates of individual genome-wide heterozygosity based on the per-sample one-dimensional Site Frequency Spectrum calculated in ANGSD. b Individual inbreeding coefficients, FRoH, defined as the fraction of the individual genomes falling into RoHs of a minimum length of 150 kb. RoHs were declared as all regions with at least two subsequent 100 kb windows harboring a heterozygosity below 1.435663 × 10⁻³. c RoH length distribution across the 12 colonies only including RoHs longer than 500 kb. A single 9.65 Mbp long RoH on pseudo-chromosome 7 in an Isle of May individual required to introduce a break in the y-axis. In (a) and (b), black dots indicate individual sample estimates and black lines the median per colony, while in (c), black dots represent single RoHs. Statistical significance of differences in heterozygosity and FRoH between populations was assessed with a global Kruskal-Wallis test (n = 12). The results of post hoc Dunn tests with Holm corrections are presented in Fig. S12. Error bars show range of values within 1.5 times the interquartile range. Different colonies in all three plots are indicated using the same color code as in Fig. 1. The dataset(s) needed to create this figure can be found at 10.6084/m9.figshare.14743317.v1.

