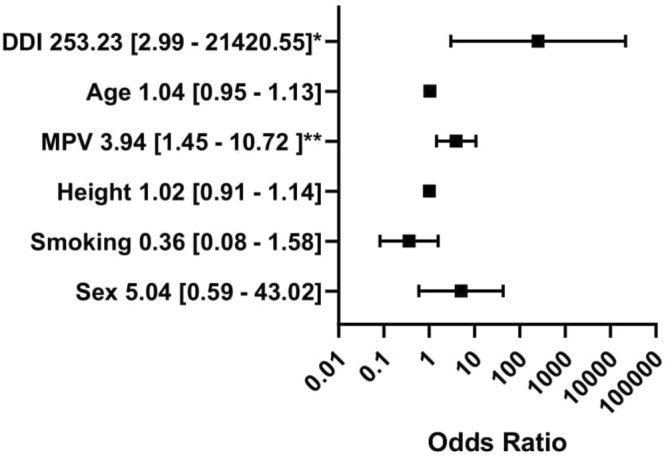
Figure 2.

Multivariable logistic regression analysis with mean platelet volume. The dependent variable: the presence of central non-dipping pattern (coded one). The outcomes presented as a dependent variable (odds ratio, 95% confidence interval). *Significant at the 0.05 level; **significant at the 0.01 level. MPV mean platelet volume, DDI daily insulin intake. All figures made by authors of the manuscript. GraphPad Prism 9 (https://www.graphpad.com/) was used to create forest plots.
