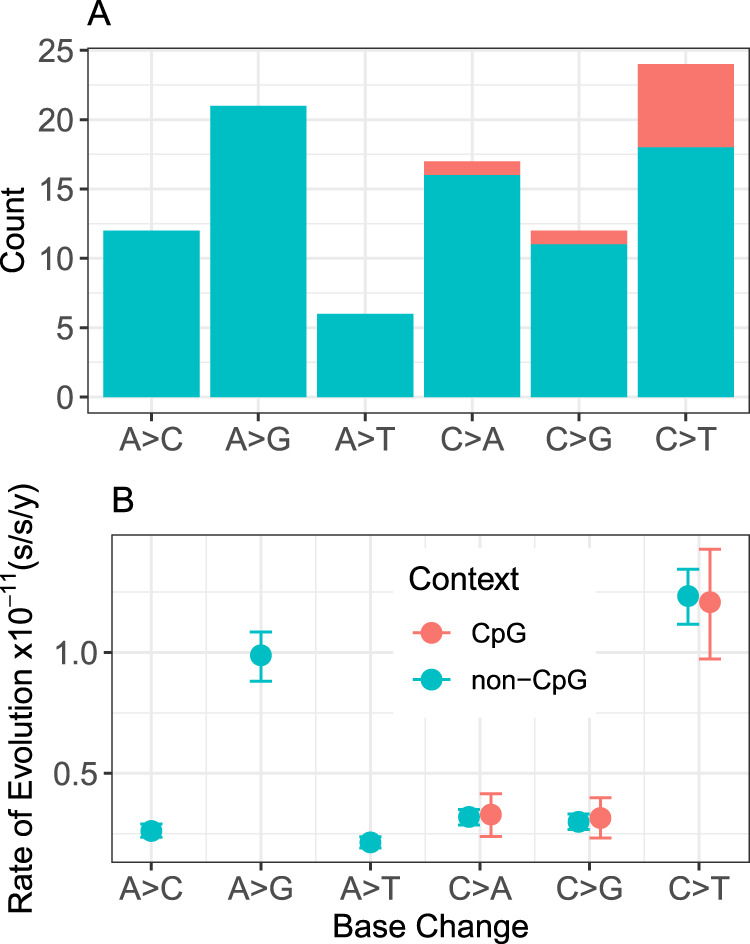
Fig. 3. Mutation spectrum of the gray mouse lemur.

A Counts of de novo mutations from the pedigree analysis. Mutation types are broken down by weak-to-strong transversions (A>C and T>G), weak-to-strong transitions (A>G and T>C), weak-to-weak transversions (A>T and T>A), strong-to-weak transversions (C>A and G>T), strong-to-strong transversions (C>G and G>C), and strong-to-weak transitions (C>T and G>A). Complementary mutation types are shown together. B Context-dependent substitution-rate estimates. Nine possible substitution-type parameters are shown for the gray mouse lemur terminal branch, which are categorized similarly as the de novo mutation spectrum. Error bars on substitution rates represent 95% highest posterior densities.
