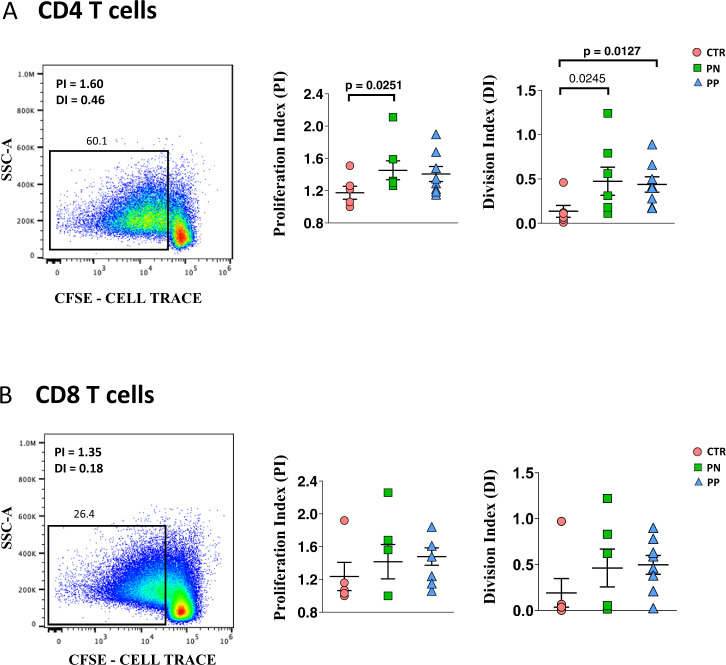
Fig. 7. Proliferation of CD4 and CD8 T cells of COVID-19 pregnant women.
A. Proliferation index (PI) and division index (DI) in all CD4+ T cells from the three groups studied. Data represent individual values (dots) from healthy donors (CTR, n = 5), pregnant negative (PN, n = 6), and pregnant positive (PP, n = 7). Values (dots) for the three conditions are matched with the color used in Figs. 1–5. Data represent individual percentage values (dots), mean (center bar) and SEM (upper and lower bars). Two-tailed Mann–Whitney t-test with Bonferroni correction has been used. The exact p-value is indicated in the figure, if significant. B. Proliferation index (PI) and division index in all CD8+ T cells from the three groups studied. Data represent individual values (dots) from CTR (n = 5), pregnant negative (PN, n = 6), and pregnant positive (PP, n = 7). Values (dots) for the three conditions are matched with the color used in Figs. 1–5. Data represent individual percentage values (dots), mean (center bar), and SEM (upper and lower bars). Two-tailed Mann–Whitney U-test with Bonferroni correction has been used. The exact p-value is indicated in the figure, if significant.

