Fig. 1.
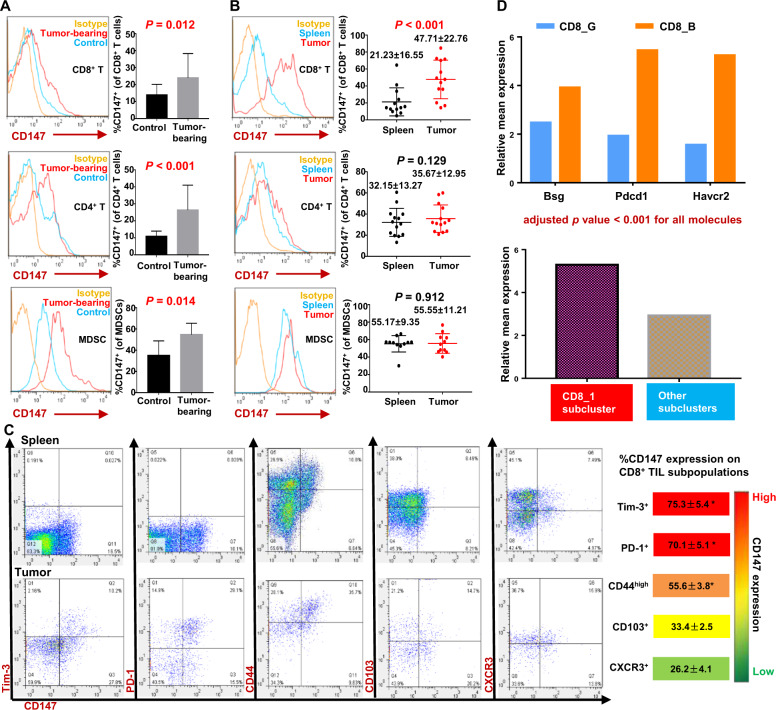
CD147 expression is upregulated on CD8+ TILs, and CD147 is coexpressed with the inhibitory receptors PD-1 and Tim-3. A Representative figures and summary data for CD147 expression on splenic CD8+ T cells, CD4+ T cells, and MDSCs from tumor-bearing or control mice. LLC cells (1 × 10⁶/mouse) were s.c. inoculated into C57BL/6 mice (11–13 mice per group), while an equal volume of serum-free medium was s.c. injected into the mice in the control group (6–7 mice per group). Splenocytes were analyzed with flow cytometry on day 16 after inoculation. MDSCs were double-labeled with an anti-CD11b antibody and anti-Gr1 antibody (RB6-8C5, reacting with a common epitope in Ly-6G and Ly-6C). An isotype antibody was used as a negative control. B CD147 expression on tumor-infiltrating or splenic CD8+ T cells, CD4+ T cells, and MDSCs from LLC tumor-bearing mice (11–14 mice per group) was analyzed with flow cytometry on day 16 after inoculation. C Coexpression patterns of CD147 with Tim-3, PD-1, CD44, CD103, or CXCR3 on tumor-infiltrating and splenic CD8+ T cells. B16–F10 melanoma cells (5 × 10⁵/mouse) were s.c. inoculated into C57BL/6 mice. Tim-3+, PD-1+, CD44high, CD103+, or CXCR3+ CD8+ T-cell subsets were gated, and the frequency of CD147+ cells within each subset was analyzed with flow cytometry on day 15 after inoculation and is summarized in the right panel (5–8 mice per group). Markers are displayed in order and color-coded according to the frequency of CD147+ cells. D scRNA-seq analysis of the transcript levels of Bsg, Pdcd1, and Havcr2 in cluster CD8_B relative to those in CD8_G or those in subcluster CD8_1 relative to those in other subclusters.35 Data are representative of two independent experiments and are presented as the mean ± STD. *P < 0.05

