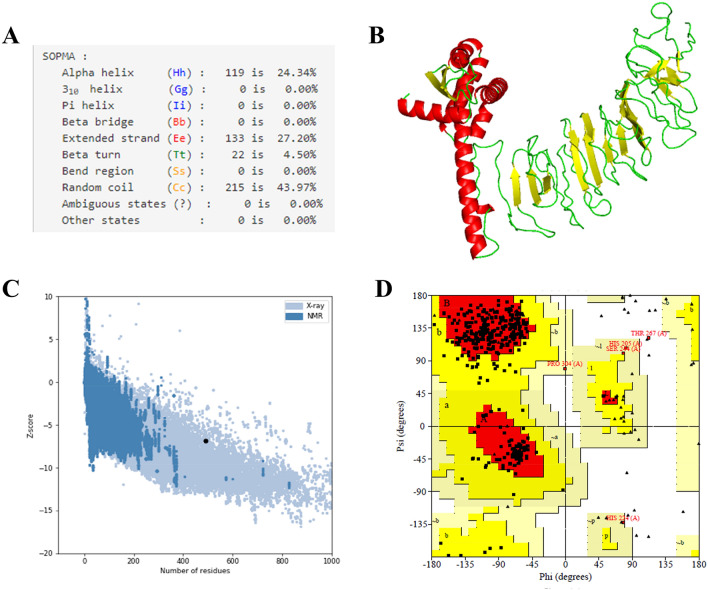
Figure 5.
(A) The secondary structural properties of the vaccine. (B) 3-D model of the final vaccine. In this structure, red, yellow, and green color represents the helical, sheet, and loop regions, respectively. (C) 3-D structure validation with a Z-score of -6.85 followed by Pro-SA. (D) Analysis of Ramachandran plot utilizing PROCHECK server showed 87%, 12%, 0.8%, and 0.3% residues laying in favoured, additional allowed, allowed, and disallowed regions, respectively.

