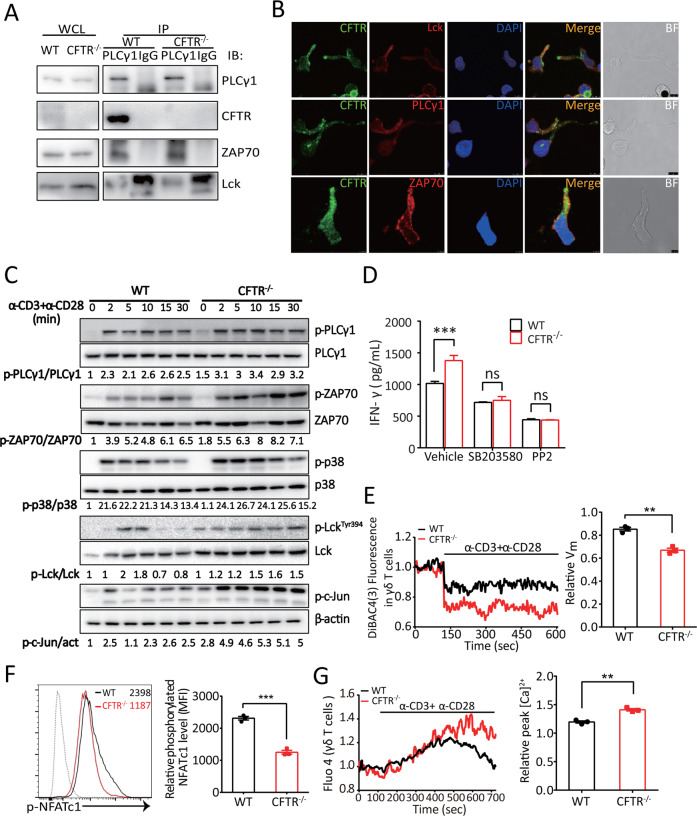
Fig. 3.
CFTR participated in TCR signaling via interaction with the PLCγ-1–LCK–ZAP70 signaling complex and contributed to TCR-induced Ca2+ influx and membrane hyperpolarization in γδ T cells. a In vitro-expanded WT or CFTR−/− γδ T cells were immunoprecipitated with an anti-PLCγ-1 antibody, and the immunoprecipitates were immunoblotted with an antibody specific for PLCγ-1, CFTR, Lck, or ZAP70. b Confocal microscopy analysis of γδ T cells stimulated with Dynabeads® Mouse T-Activator CD3/CD28 and stained with a mouse anti-CFTR antibody followed by an Alexa Fluor 488-conjugated anti-mouse IgG or with an antibody to PLCγ-1, Lck, or ZAP70 followed by an Alexa Fluor 594-conjugated anti-rabbit IgG was performed (scale bar: 5 μm, BF: bright field). c A representative immunoblot analysis (from three independent experiments) of the indicated proteins in the whole-cell lysates of in vitro-expanded WT or CFTR−/− γδ T cells treated with soluble anti-CD3 (10 μg/ml) and anti-CD28 (1 μg/ml) antibody stimulation for 2, 5, 10, 15, or 30 min is shown. Band densities were quantified with ImageJ and ratios of indicated intensities were shown. act: actin. d ELISA analysis of IFN-γ production by in vitro-expanded and purified WT or CFTR−/− γδ T cells treated with SB203580 (10 μM) or PP2 (10 μM) for 12 h was performed (n = 3 for each group, ***p < 0.001). e The cytoplasmic Vm of WT or CFTR−/− γδ T (1 × 10⁶ cells for each group) treated with soluble anti-CD3 (10 μg/ml) and anti-CD28 (1 μg/ml) antibody stimulation was measured, and the relative Vm in WT or CFTR−/− γδ T cells was quantified (n = 3, **p < 0.01). f Flow cytometry and statistical analyses of the relative phosphorylated NFATc1 level in in vitro-expanded WT or CFTR−/− γδ T cells treated with soluble anti-CD3 (10 μg/ml) and anti-CD28 (1 μg/ml) antibody stimulation for 30 min are shown (n = 3, ***p < 0.001). g The [Ca2+]i of WT or CFTR−/− γδ T cells (1 × 10⁶ cells for each group) treated with soluble anti-CD3 (10 μg/ml) and anti-CD28 (1 μg/ml) antibody stimulation were measured, and the relative peak [Ca2+]i for the WT and CFTR−/− γδ T cells were quantified (n = 3, **p < 0.01)

