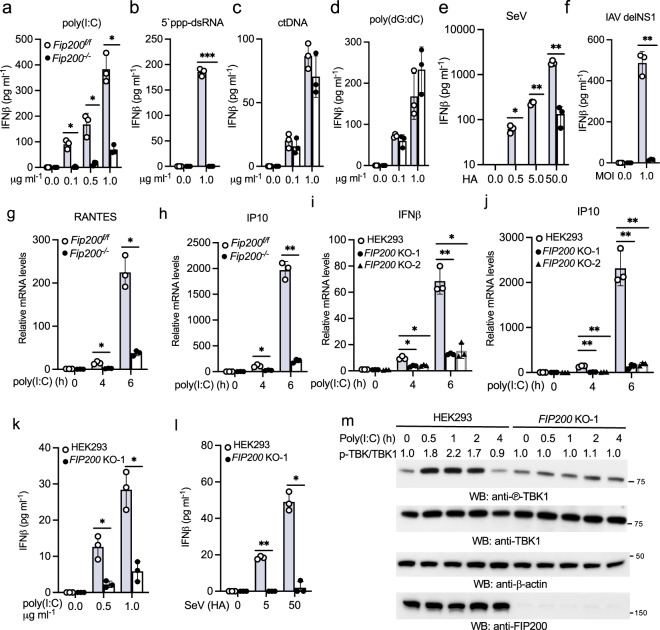
Fig. 3. FIP200 deficiency impairs RIG-I activation in fibroblasts.
a–d Fip200f/f and Fip200−/− MEFs were transfected with indicated amount of poly(I:C) (a), 5′ ppp-dsRNA (b), calf thymus DNA (ctDNA) (c), or poly(dG:dC) (d). After 16 h, the supernatants were collected for IFNβ ELISA assays. All experiments were biologically repeated three times. Data represent means ± s.d. of three independent experiments. The P-value was calculated (two-tailed Student’s t test) by comparison with the Fip200f/f cells. *P < 0.05, ***P < 0.001. e, f Fip200f/f and Fip200−/− MEFs were infected with Sendai virus (SeV) (e) or influenza A virus PR8 with NS1 deletion (IAV delNS1) (f). After 16 h, the supernatants were collected for IFNβ ELISA assays. All experiments were biologically repeated three times. Data represent means ± s.d. of three independent experiments. The P-value was calculated (two-tailed Student’s t test) by comparison with the Fip200f/f cells. *P < 0.05, **P < 0.01. g, h Fip200f/f and Fip200−/− MEFs were stimulated with 1 μg ml−1 poly(I:C) for indicated times. Real-time PCR was performed to determine the relative mRNA levels of RANTES (g) and IP10 (h). All experiments were biologically repeated three times. Data represent means ± s.d. of three independent experiments. The P-value was calculated (two-tailed Student’s t test) by comparison with the Fip200f/f cells. *P < 0.05, **P < 0.01. i, j Wild type and two FIP200 knockout HEK293 cell lines were stimulated with 1 μg ml−1 poly(I:C) for indicated times. Real-time PCR was performed to determine the relative mRNA levels of IFNβ (i) and IP10 (j). All experiments were biologically repeated three times . Data represent means ± s.d. of three independent experiments. The P-value was calculated (two-tailed Student’s t test) by comparison with wild-type cells. *P < 0.05, **P < 0.01. k–l Wild type and the FIP200 knockout HEK293 cells were treated with the designated amount of poly(I:C) (k) or Sendai virus (l) for 16 h. IFNβ production was measured by ELISA. All experiments were biologically repeated three times. Data represent means ± s.d. of three independent experiments. The P-value was calculated (two-tailed Student’s t test) by comparison with wild-type cells. *P < 0.05, **P < 0.01. m FIP200 wild type and knockout HEK293 cells were stimulated with μg ml−1 poly(I:C) for indicated times. Cell lysates were collected and blotted as indicated. Band densitometry was calculated by Image J. The ratio of phosphorylated TBK1 to total TBK1 in each lane was indicated.

