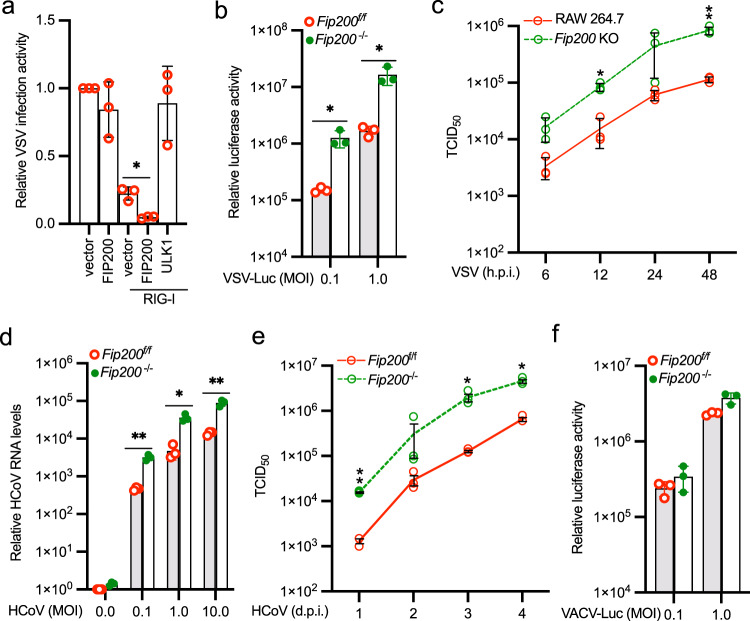
Fig. 6. FIP200 deficiency increases host susceptibility to RNA virus infection.
a RIG-I was transfected with vector, FIP200, or ULK1 into HEK293 cells. After 24 h, cells were infected with the VSV carrying a luciferase gene (VSV-Luc) for 16 h. Luciferase activity was measured to determine relative viral infection activity. All experiments were biologically repeated three times. Data represent means ± s.d. of three independent experiments. (*P < 0.05, by two-tailed Student’s t test). b Fip200f/f and Fip200−/− MEFs were infected with VSV-Luc for 16 h. Luciferase activity was measured to determine relative viral infection activity. All experiments were biologically repeated three times. Data represent means ± s.d. of three independent experiments. The P-value was calculated (two-tailed Student’s t test) by comparison with wild-type cells. *P < 0.05. c Wild type and FIP200 knockout RAW 264.7 macrophages were infected with 0.001 MOI of VSV. After the designated hour post-infection (h.p.i), virus titers were determined by TCID50 in Vero cells. All experiments were biologically repeated three times. Data represent means ± s.d. of three independent experiments. The P-value was calculated (two-tailed Student’s t test) by comparison with the wild-type cells. *P < 0.05, **P < 0.01. d Fip200f/f and Fip200−/− MEFs were infected with the indicated MOI of HCoV OC43. After 24 h, the RNA levels of viral membrane gene were determined by qPCR. All experiments were biologically repeated three times. Data represent means ± s.d. of three independent experiments. The P-value was calculated (two-tailed Student’s t test) by comparison with the wild-type cells. *P < 0.05, **P < 0.01. e Fip200f/f and Fip200−/− MEFs were infected with 0.1 MOI of HCoV OC43. After the designated day post-infection (d.p.i), virus titers were determined by TCID50 in Vero cells. All experiments were biologically repeated three times. Data represent means ± s.d. of three independent experiments. The P-value was calculated (two-tailed Student’s t test) by comparison with the wild-type cells. *P < 0.05, **P < 0.01. f Fip200f/f and Fip200−/− MEFs were infected with the VACV carrying a luciferase gene (VACV-Luc) for 16 h. Luciferase activity was measured to determine relative viral infection activity. All experiments were biologically repeated three times. Data represent means ± s.d. of three independent experiments.

