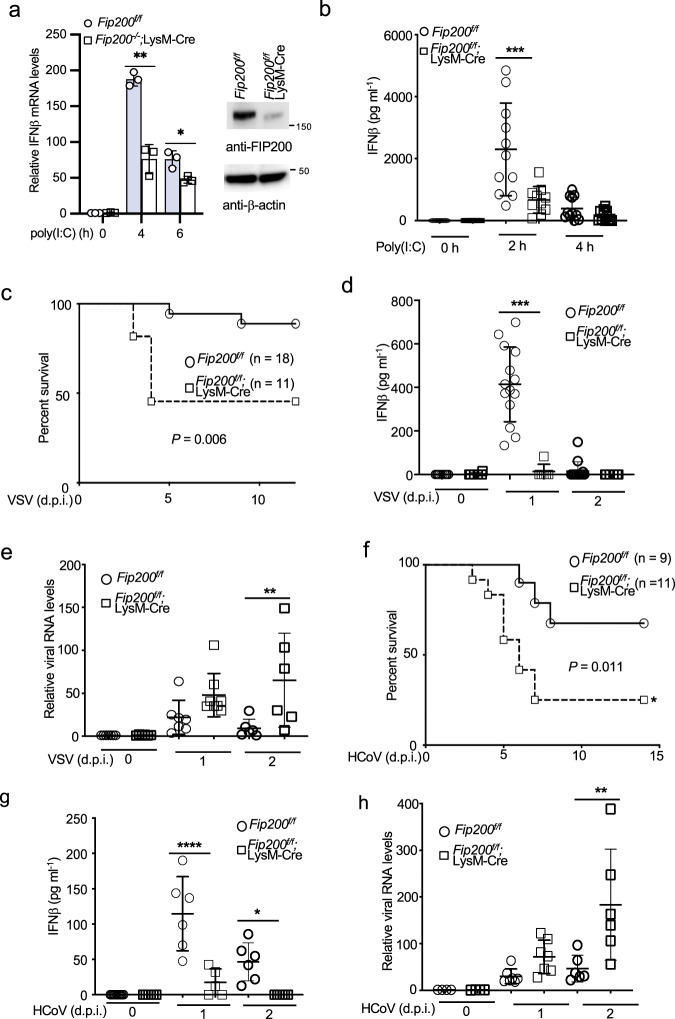
Fig. 7. FIP200 is required for innate host defense to RNA virus infection in vivo.
a The BMDMs of Fip200f/f and Fip200f/f;LysM-Cre mice were stimulated with 1 μg ml−1 of poly(I:C) for indicated times. Real-time PCR was performed to determine the relative IFNβ mRNA levels. Data represent means ± s.d. of three independent experiments. The P-value was calculated (two-tailed Student’s t test) by comparison with the wild-type cells. *P < 0.05, **P < 0.01. The right panel shows the knockout efficiency by Western blotting. b Fip200f/f and Fip200f/f;LysM-Cre mice were injected with 50 μg of poly(I:C) plus 6 μl of in vivo-jetPEI via tail vein for designated times. Blood was collected for IFNβ ELISA assay. ***P < 0.001, by one-way ANOVA, followed by Tukey’s multiple comparison test. c Survival curve of VSV-infected Fip200f/f and Fip200f/f;LysM-Cre mice. Eighteen Fip200f/f mice and eleven Fip200f/f;LysM-Cre mice were infected with 2 × 10⁵ TCID50 of VSV intravenously. Mice were monitored at the indicated d.p.i. P = 0.006, calculated by Mantel–Cox log-rank test. d Fip200f/f and Fip200f/f;LysM-Cre mice were infected with 2 × 10⁵ TCID50 of VSV intravenously. Blood was collected for IFNβ ELISA assays at 0, 1, and 2 d.p.i. ***P < 0.001, by one-way ANOVA, followed by Tukey’s multiple comparison test. e Fip200f/f and Fip200f/f;LysM-Cre mice were infected with 2 × 10⁵ TCID50 of VSV intravenously. Brain tissues were collected for RNA extract. VSV RNA levels were determined by real-time PCR. **P < 0.01, by one-way ANOVA, followed by Sidak’s multiple comparisons test. f Survival curve of HCoV OC43-infected Fip200f/f and Fip200f/f;LysM-Cre mice. Nine Fip200f/f mice and elven Fip200f/f;LysM-Cre mice were infected with 1 × 10⁵ TCID50 of HCoV OC43 intracerebrally. Mice were monitored at the indicated day post-infection (d.p.i.). P = 0.011, calculated by Mantel–Cox log-rank test. g Fip200f/f and Fip200f/f;LysM-Cre mice were infected with 1 × 10⁵ TCID50 of HCoV OC43 intravenously. Blood was collected for IFNβ ELISA assays at 0, 1, and 2 d.p.i. *P < 0.05, ****P < 0.0001, by one-way ANOVA, followed by Tukey’s multiple comparison test. h Fip200f/f and Fip200f/f;LysM-Cre mice were infected with 1 × 10⁵ TCID50 of HCoV OC43 intravenously. Brain tissues were collected for RNA extract. HCoV RNA levels were determined by real-time PCR. **P < 0.01, by one-way ANOVA, followed by Tukey’s multiple comparison test.

