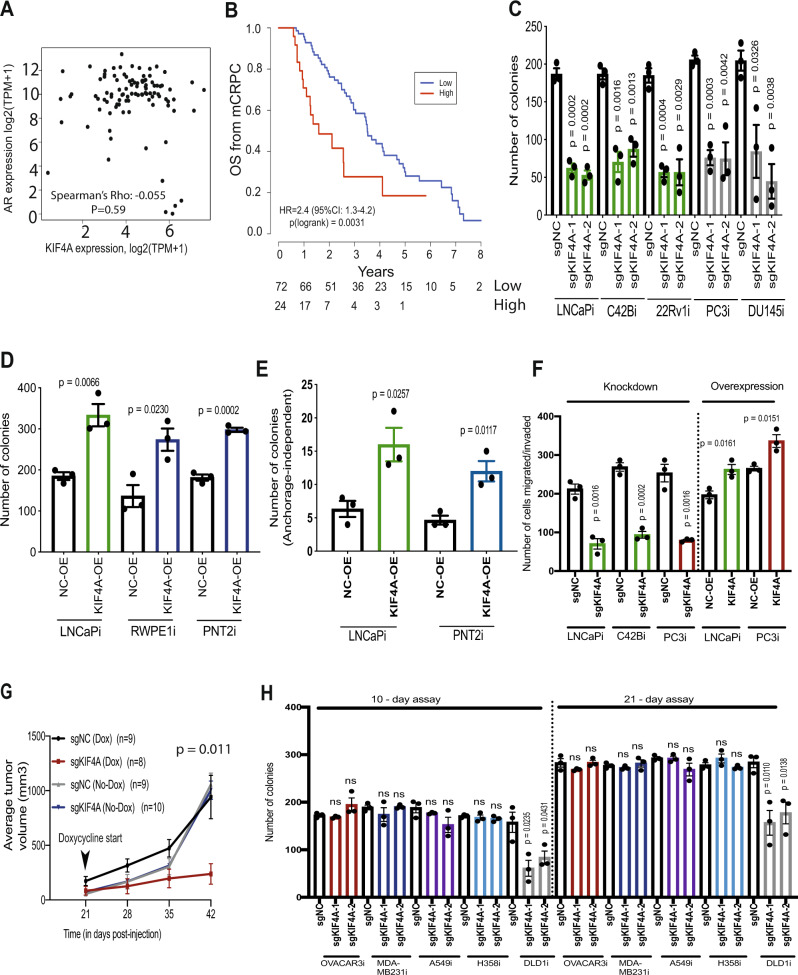
Fig. 2. KIF4A is an AR-independent driver gene in metastatic prostate cancer.
A Scatter plot showing no correlation between AR and KIF4A in 99 mCRPC patients based on a two-sided Spearman’s correlation test (Quigley et al); B A Kaplan–Meier curve of overall survival of 96 patients with CRPC with high and low level of KIF4A. Differences between groups were tested with a two-sided log-rank test. Hazard ratios were calculated using the Cox proportional hazards regression model. Number at risk is shown under the plot; C Colony formation assay in range of prostate cancer cell-line models with KIF4A knockdown (n = 3 as biological replicates; Mean ± SEM; Unpaired two-tailed t-test was used to determine statistical significance); D Colony formation assay in malignant and benign prostate cells with KIF4A overexpression (n = 3 as biological replicates; Mean ± SEM; Unpaired two-tailed t-test was used to determine statistical significance); E Anchorage-independent growth assay in malignant and benign prostate cells with KIF4A overexpression (n = 3 as biological replicates; Mean ± SEM; Unpaired two-tailed t-test was used to determine statistical significance); F Migration and Invasion assay with KIF4A knockdown and overexpression in malignant prostate cells (n = 3 as biological replicates; Mean ± SEM; Unpaired two-tailed t-test was used to determine statistical significance); G Line plot showing average tumor volume in KIF4A knockdown and control cells implanted in vivo. Average tumor volume was plotted and two-way ANOVA was used to measure statistical significance; H Colony formation assay in a range of non-prostate cancer CRISPRi cell-line models with KIF4A knockdown (n = 3 as biological replicates; Mean ± SEM; Unpaired two-tailed t-test was used to determine statistical significance).

