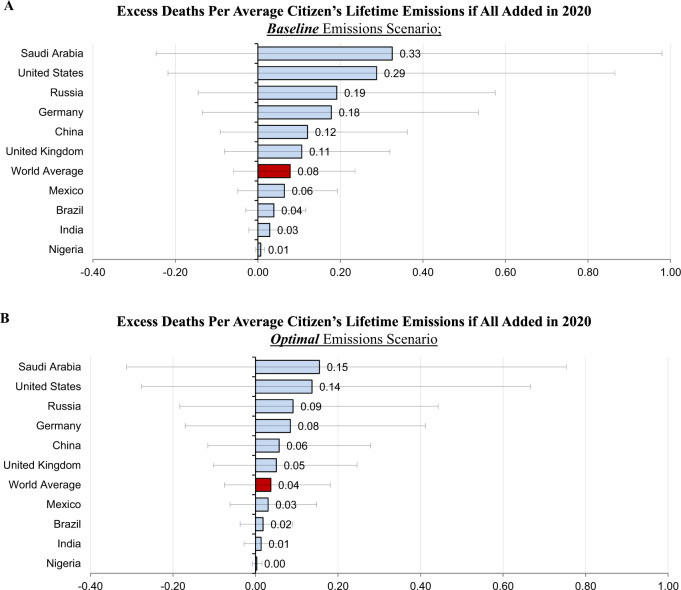
Fig. 1. Implications of the 2020 mortality cost of carbon.
Average lifetime emissions are calculated as 2017 carbon dioxide emissions production per capita multiplied by 2017 life expectancy at birth. The error bars show the low (<10th percentile) and high (>90th percentile) mortality estimates (see “Methods” section for more details on uncertainty). A The 2020 MCC in the baseline emissions scenario is 2.26 × 10⁻⁴ excess deaths per metric ton of 2020 emissions in the central estimate. This implies that the lifetime emissions of an average American (1,276 metric tons) causes 0.29 excess deaths in expectation if all added in 2020, the lifetime emissions of an average Indian (127 metric tons) causes 0.03 excess deaths in expectation if all added in 2020, and the lifetime emissions of an average person in the world (347 metric tons) causes 0.08 excess deaths if all added in 2020. B The 2020 MCC in the optimal emissions scenario is 1.07 × 10⁻⁴ excess deaths per metric ton of 2020 emissions in the central estimate. This implies that the lifetime emissions of an average American (1,276 metric tons) causes 0.15 excess deaths in expectation if all added in 2020, the lifetime emissions of an average Indian (127 metric tons) causes 0.01 excess deaths in expectation if all added in 2020, and the lifetime emissions of an average person in the world (347 metric tons) causes 0.04 excess deaths if all added in 2020.

