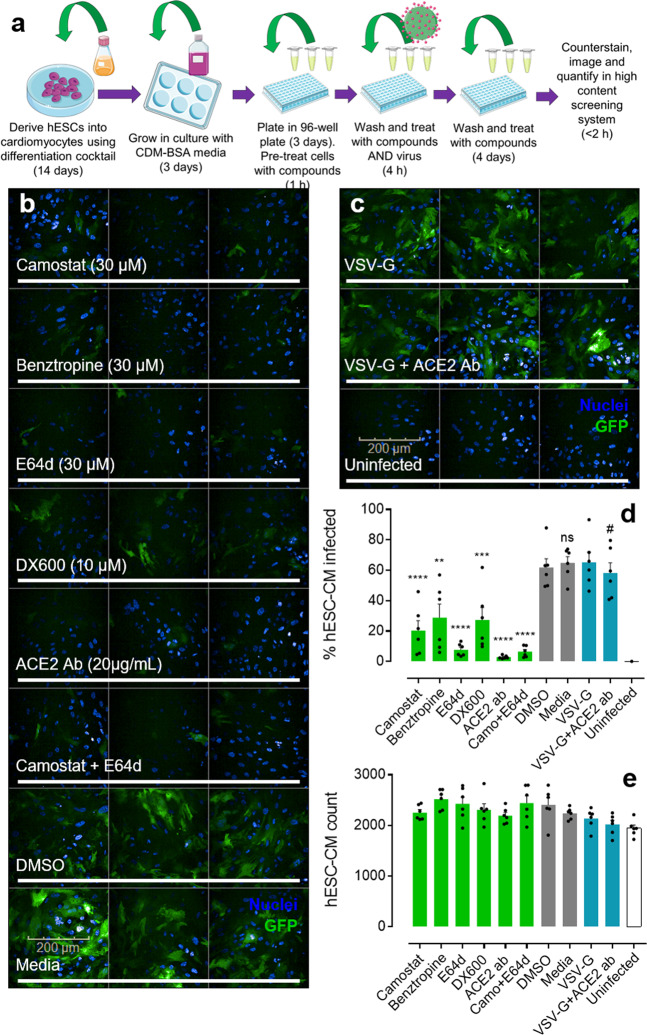
Fig. 2. SARS-CoV-2 spike-pseudotyped viral infection, and pharmacological inhibition, in hESC-CMs.
a Schematic showing the experimental workflow in brief for generating human embryonic stem cell-derived cardiomyocytes (hESC-CMs) and taking them into the pseudotyped lentiviral infection drug screen before conducting quantitative imaging (see Methods for further details). The schematic was generated using templates from Servier Medical Art (https://smart.servier.com/) b Representative fluorescent confocal images (n = 2 independent experiments performed in triplicate) of hESC-CMs pretreated with small molecule inhibitors (camostat, benztropine, and E64d), peptide antagonist (DX600), or antibody (ACE2 Ab) targeting protein components involved in SARS-CoV-2 infection. Control cells were treated with DMSO (0.6%) or media. Cells were treated with drugs for 1 h before incubation with SARS-CoV-2 spike-pseudotyped GFP-expressing (green) lentivirus for 4 h. After removal of viral particles, cells were washed and maintained in the presence of drugs for 5 days before fixation with 4% formaldehyde and staining with Hoechst 33342 nuclear marker (blue). Scale bar shows 200 μm. c Representative fluorescent confocal images (n = 2 independent experiments performed in triplicate) of control human embryonic stem cell-derived cardiomyocytes (hESC-CMs) treated with VSV-G pseudotyped GFP-expressing (green) lentivirus, in the absence (upper) or presence (middle) of antibody (ACE2 Ab). Uninfected controls were not treated with viral particles (bottom). Again, cells were stained with Hoechst 33342 nuclear marker. d Graphical data showing the percentage of observed hESC-CMs infected with either SARS-CoV-2 spike or VSV-G (control) pseudotyped lentivirus in the presence of drugs or DMSO (0.6%) as indicated. Uninfected cells were not treated with viral particles. **p < 0.005; ***p < 0.0005; ****p < 0.00005; and ns = no significant difference (as determined by one-way ANOVA) for each condition versus the DMSO treated control cells. # = no significant difference for condition versus the VSV-G control. e Graphical data showing the overall count of observed hESC-CMs for each condition, as indicated. No condition showed a count significantly different (as determined by one-way ANOVA) from the DMSO treated control cells. All graphical data are mean ± SEM, with individual data points indicated.

