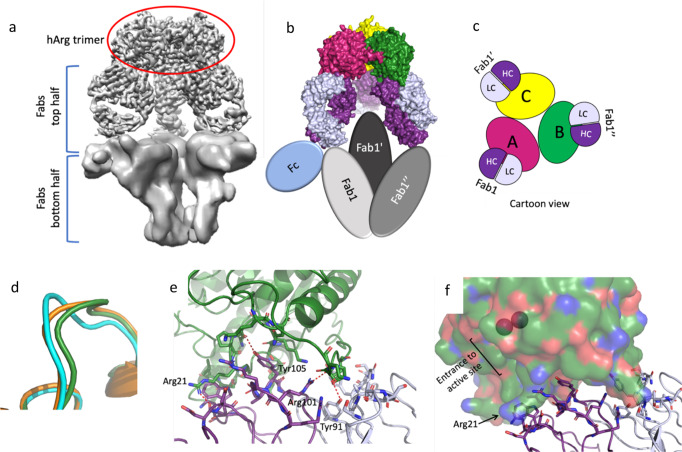
Fig. 5. Overall complex formation and epitope mapping for mAb5 1:3 complex.
a Density for the bottom half of the complex is almost completely absent. In masked maps at very low contour it is possible to visualize some density for the other Fabs and the Fcs, but the Fabs on the bottom half appear to be in a different conformation and closer to each other with no density for Arginase trimer present. b This panel shows an overview of how the 1:3 hArg1 to mAb5 complex assembles, with the three monomers of the hArg1 trimer colored in green, pink, and yellow, and the mAbs colored in dark purple (heavy chain) and pale purple (light chain). The protein surfaces are shown for the top half of the complex, and the bottom half Fabs and one Fc shown in colored ovals. c A depiction of the complex for ease of interpretation is shown. Each antibody interacts with only one hArg1 monomer and these interactions are symmetric around the trimer. d The loop containing residues Lys16-Val24 is shown for hArg1 bound to mAb5 antibody (cyan), hArg1 bound to mAb1 (green), and hArg1 bound to a small molecule (orange) are depicted. e Details of the interactions between the Fab and the hArg1 monomer are shown, with several residues involved in hydrogen bonding interactions labeled. f A surface view of one of the hArg1 monomers (green) shows that the active site is fully exposed in this complex. The binuclear active site manganese ions are shown as purple spheres.

