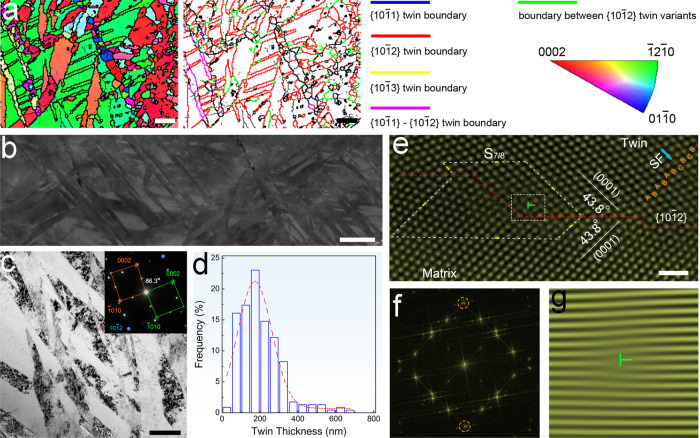
Fig. 1. Microstructure of high-density twins.
a Inverse pole figure map and boundary misorientation map for UFT-4, scale bar = 2 μm. b Electron channeling contrast image of twins in UFT-4, scale bar = 2 μm. c Transmission electron microscopy (TEM) image, scale bar = 500 nm. d Distribution of twin thickness in UFT-4; (e) HAADF-STEM image for twin boundary, scale bar = 1 nm; (f) Fast Fourier transform pattern; (g) Dislocation displayed by the IFFT lattice fringe image generated by mask diffractions of two crystals in an image (f). Solid solution-treated AZ80 with compression passes for 1, 3, 6, and 12 are designated as UFT-1, UFT-2, UFT-3, and UFT-4, respectively. SF and S7/8 in e denote stacking fault and twinning dislocation around the step, respectively.

